Start a long way out
Electricity is made far from the city and arrives on tall lines. Water comes down from the hills. Data travels on glass fibre. An AI data centre needs all three, and a great deal of the first.
 Book a chat
PoP Labs · The AI Transition
The same drawing and the same figures, as a page you can read from top to bottom.
Indicative, set in Melbourne. Not a real site. Headline figures are rounded.
an indicative AI data centre · set in Melbourne · not a real site
This is an indicative AI data centre, set in Melbourne. No real data centre is shown. Its figures are rounded, representative values chosen from published ranges, and the range behind each one is a tap away.
The setting is Melbourne: the grid, the water and the planning rules are Melbourne's and Victoria's. The building is an indicative Australian design. Its design draws on proposals and guidance from across Australia and overseas, not on a Melbourne site.
A figure marked est. is an estimate. The typical draw is an assumption, and the water figure for dry coolers in Melbourne's summers is the weakest in the file. The cooling switch shows the other design.
From the city grid down to one graphics card.
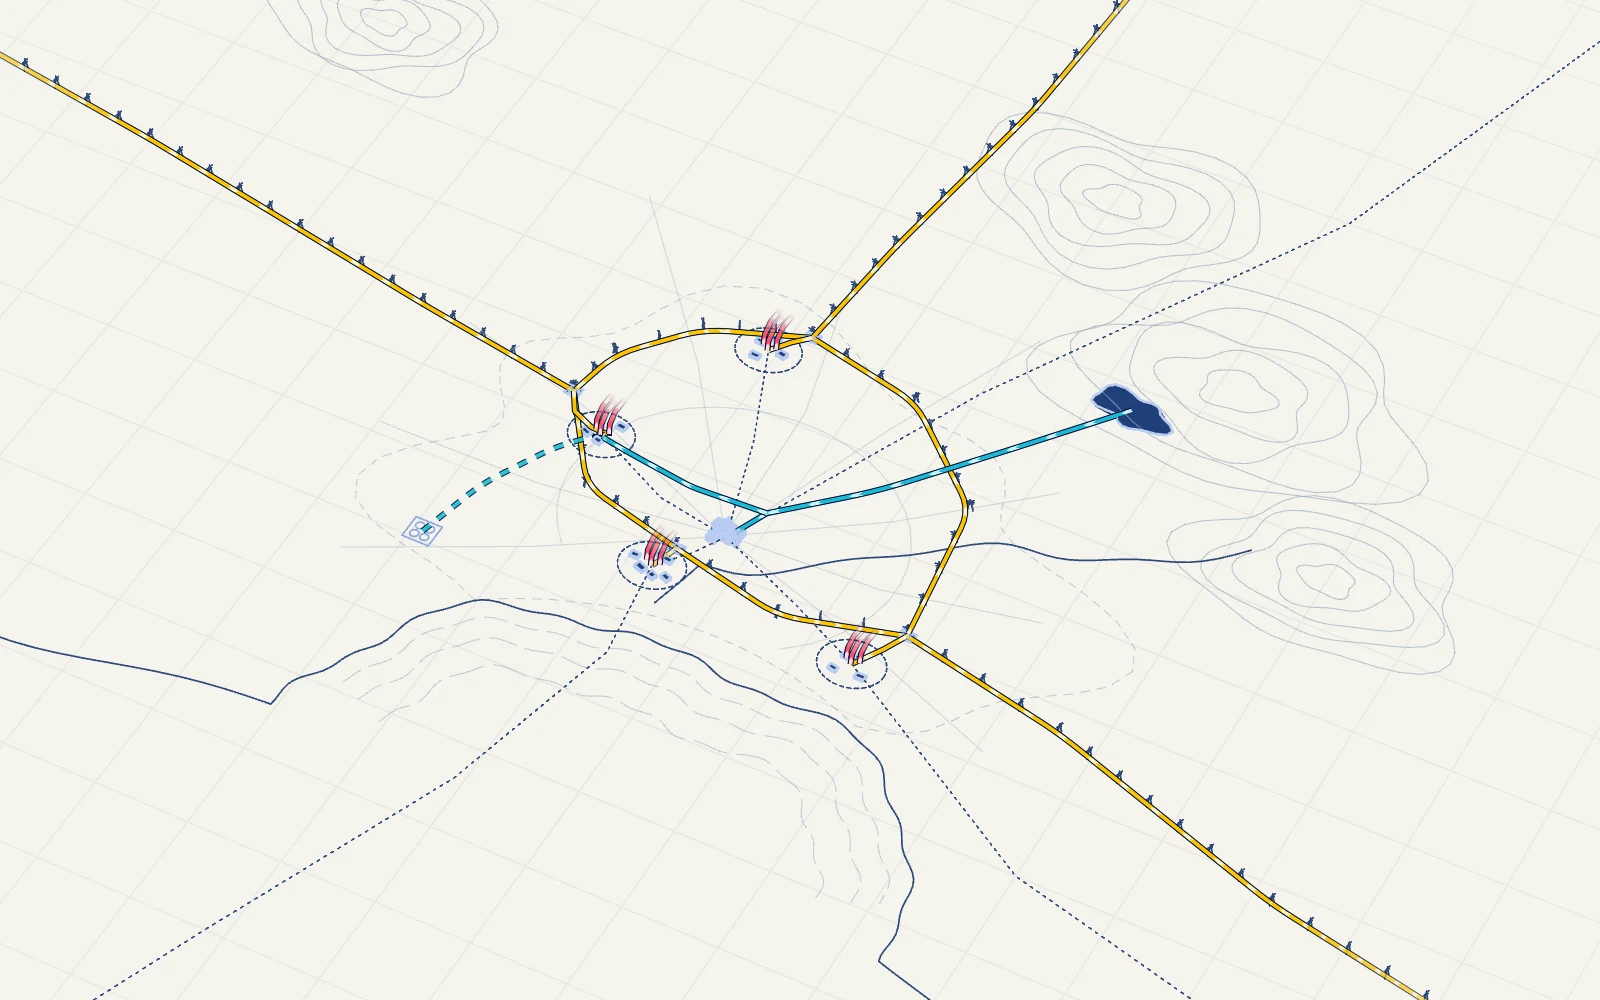
Electricity is made far from the city and arrives on tall lines. Water comes down from the hills. Data travels on glass fibre. An AI data centre needs all three, and a great deal of the first.
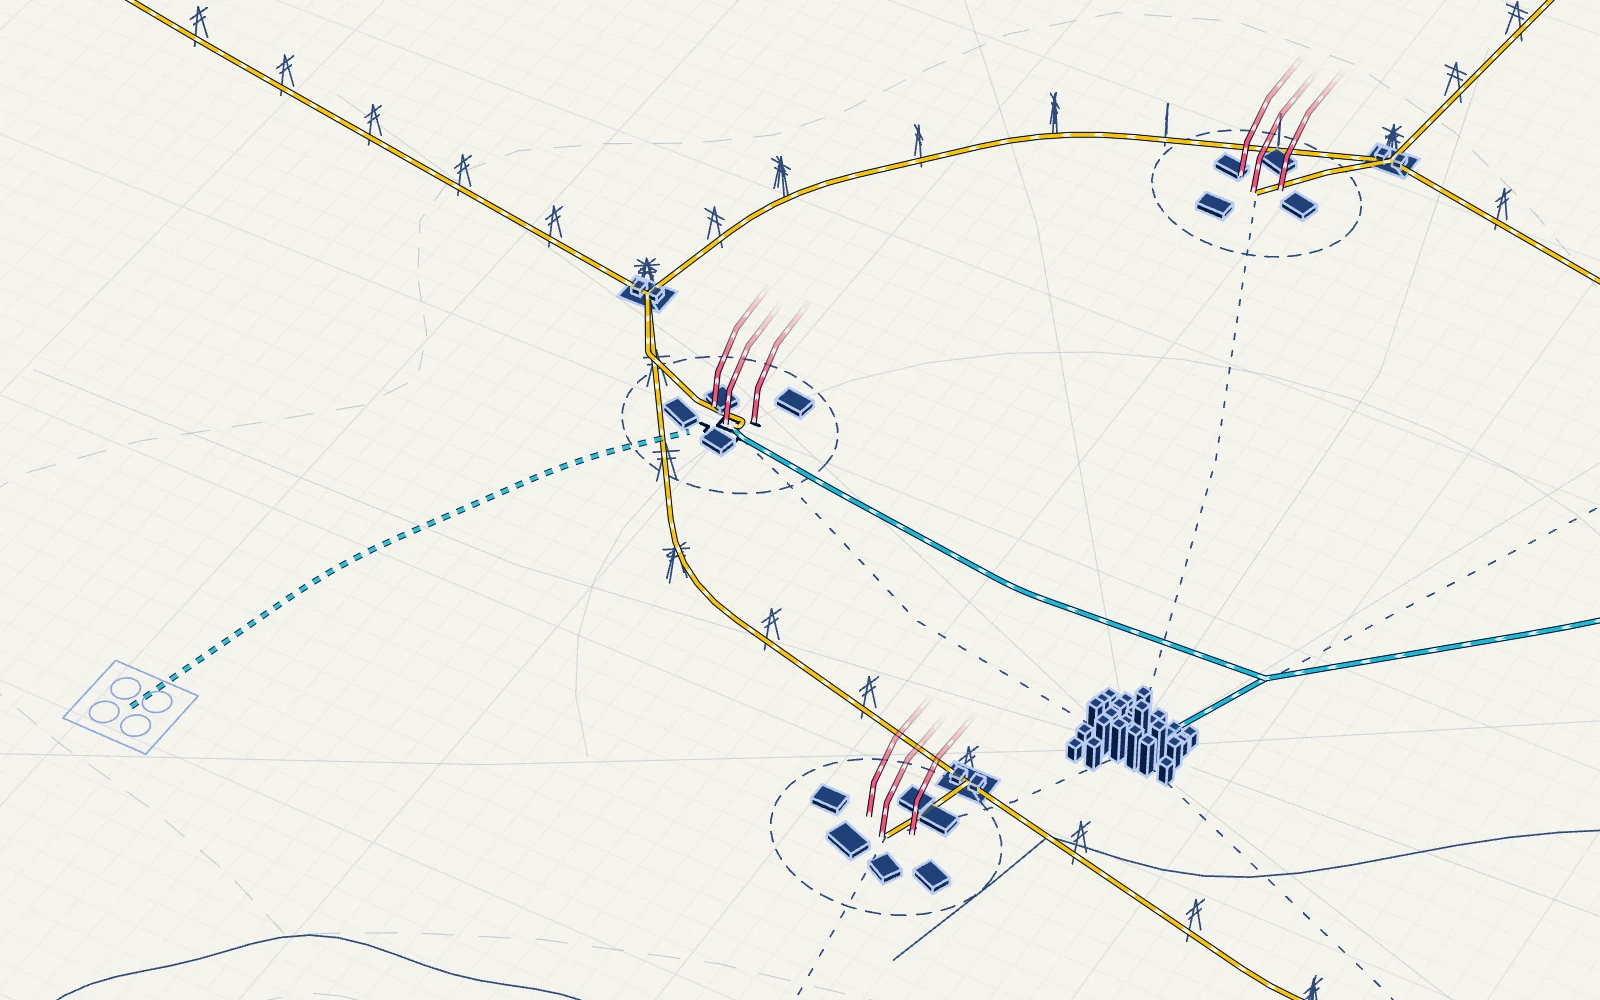
Data centres bunch together where the grid is strong and the fibre is close. The one we are heading for is drawn in full.
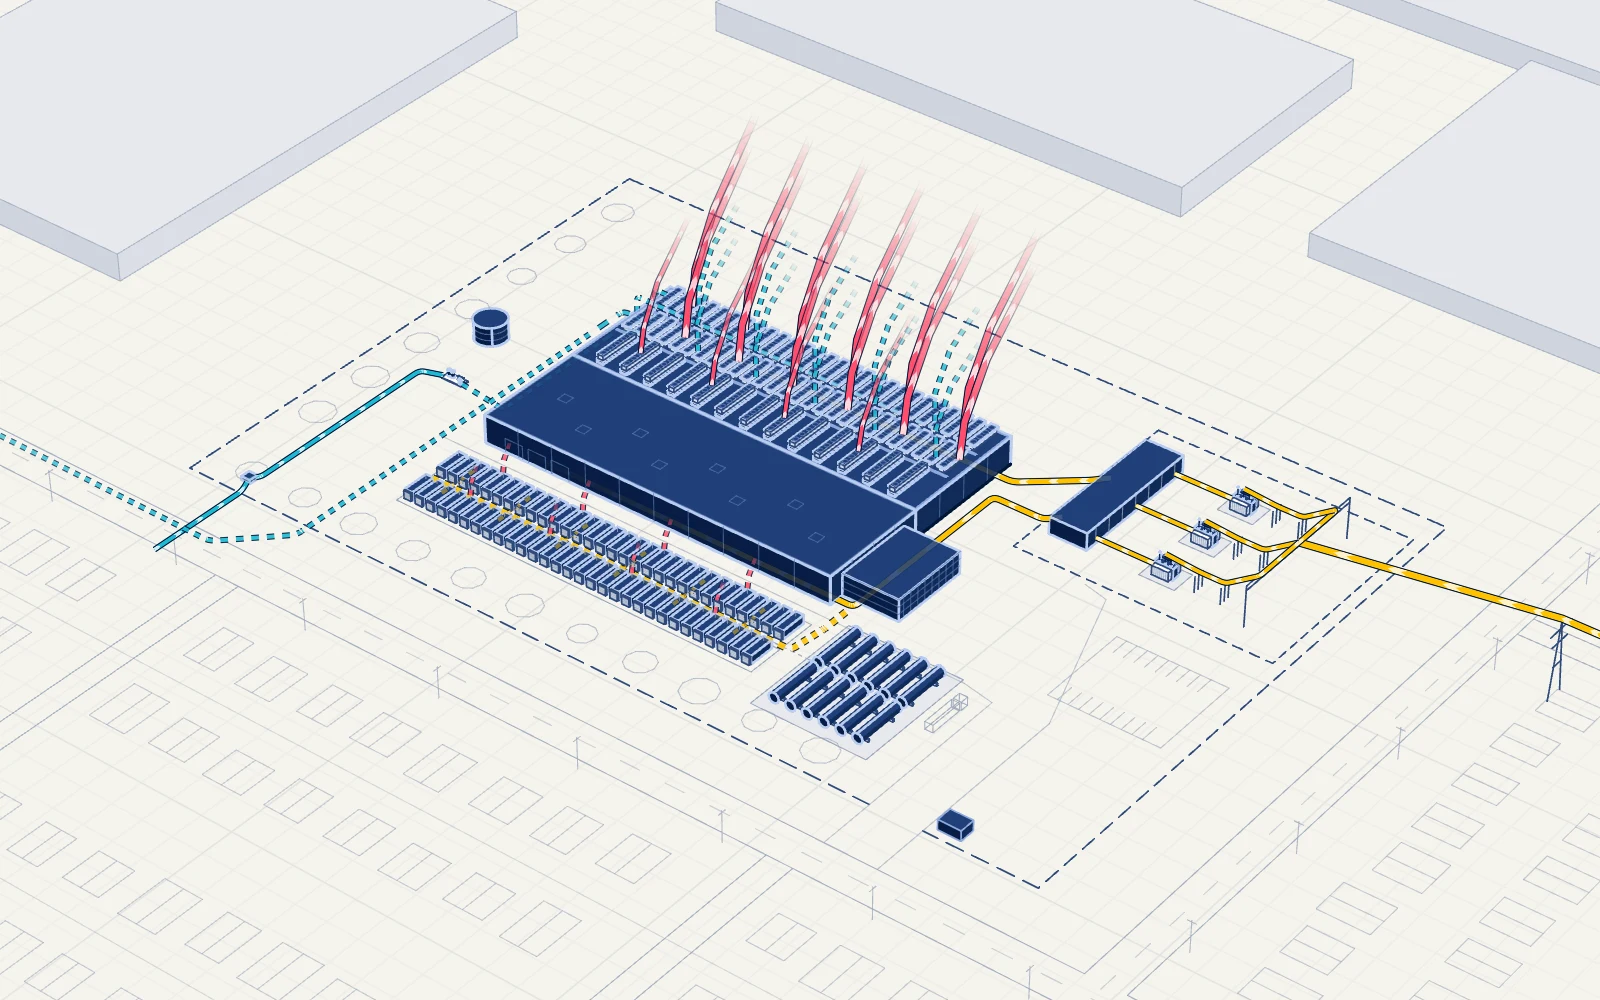
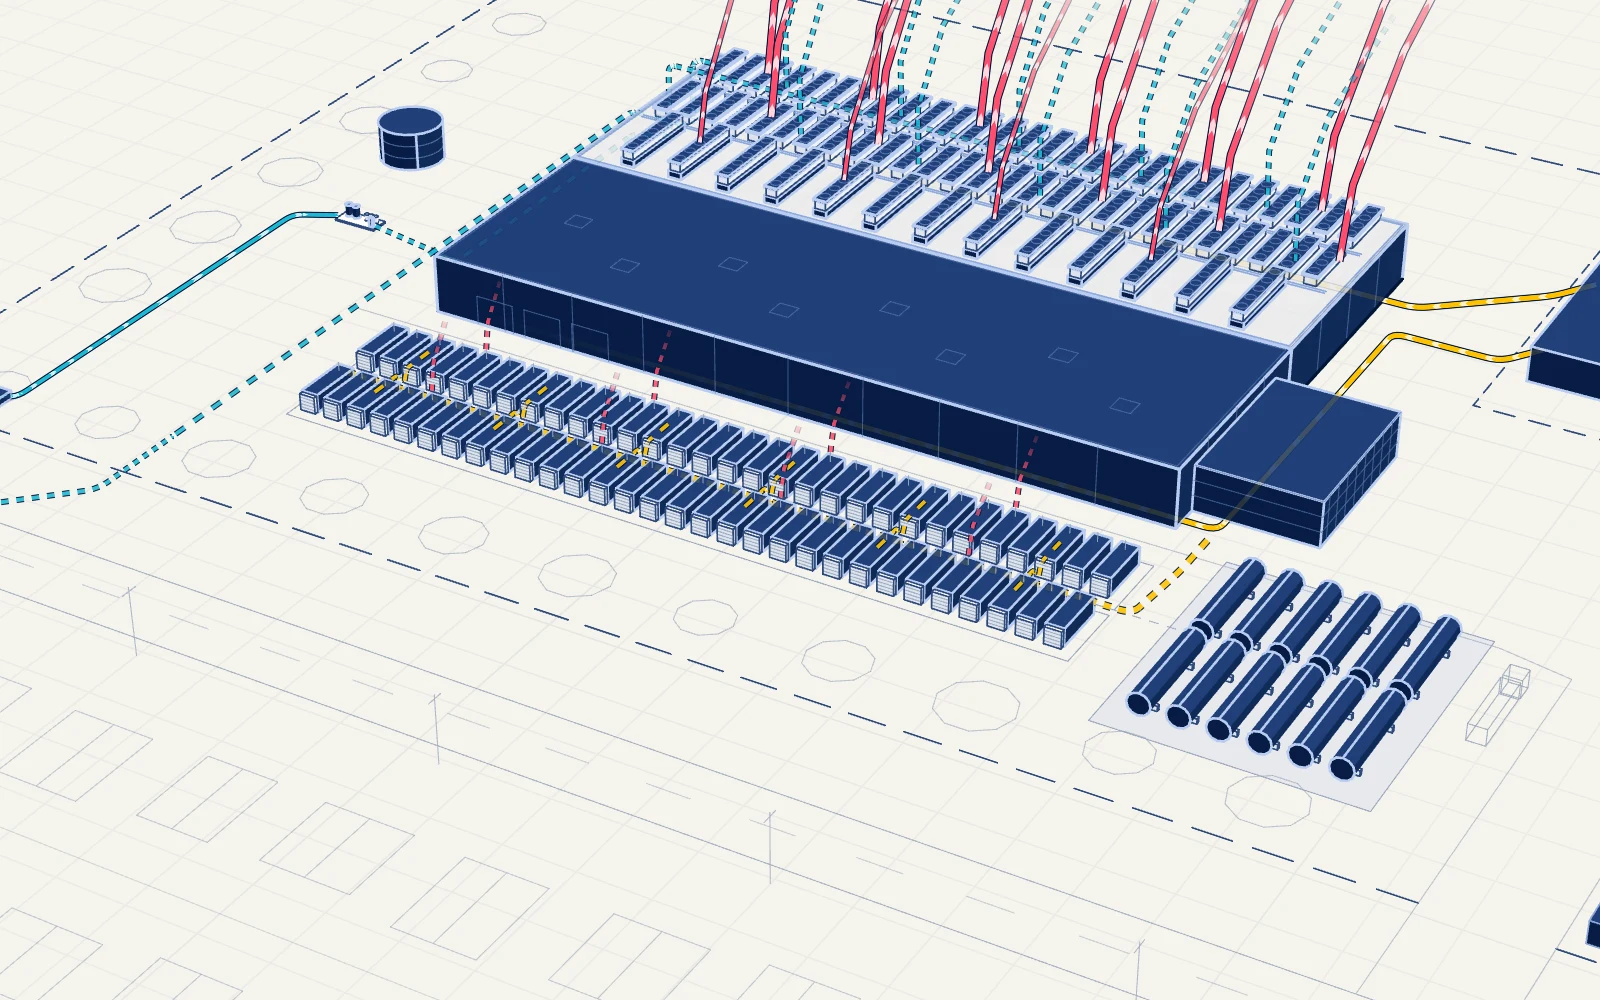
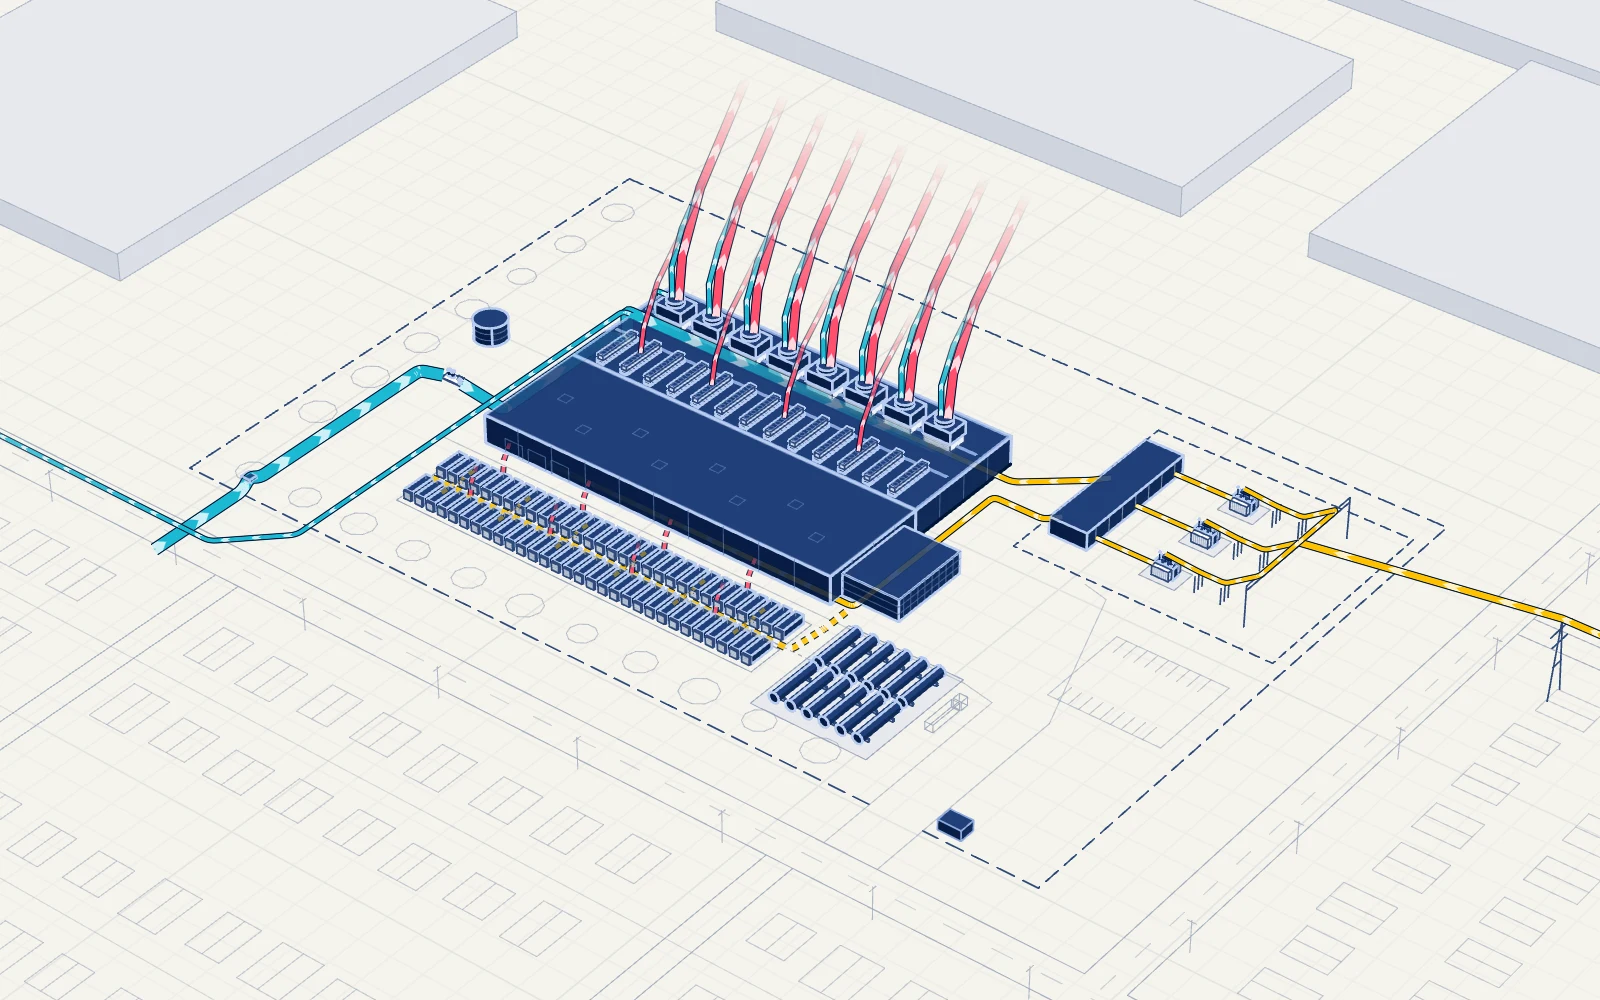
One building of 10 data halls, with its own substation, a yard of generators and the cooling plant on the roof. Of the 120 MW, 100 MW is for the computers and 20 MW runs the cooling or is lost on the way.
One building of 10 data halls, with its own substation, a yard of generators and the cooling plant on the roof. Of the 84 MW, 70 MW reaches the computers and 14 MW runs the cooling or is lost on the way.
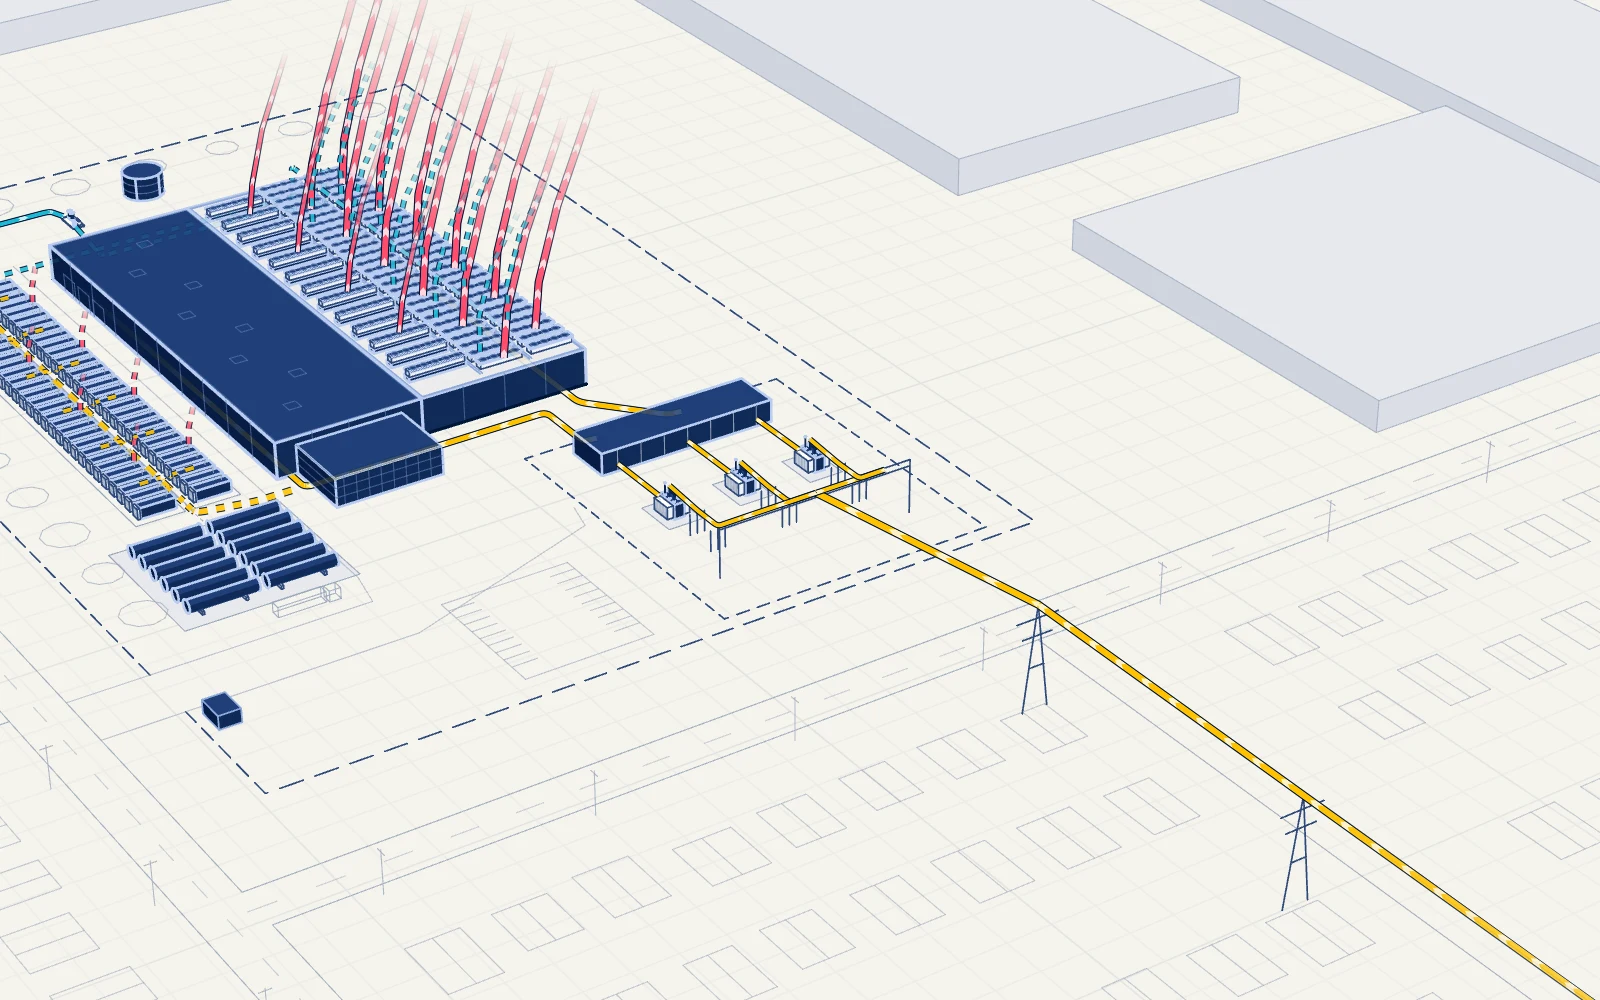
The line from the grid lands in the site's own substation. 3 large transformers step the voltage down, and the power runs through the switchroom and on to the halls.
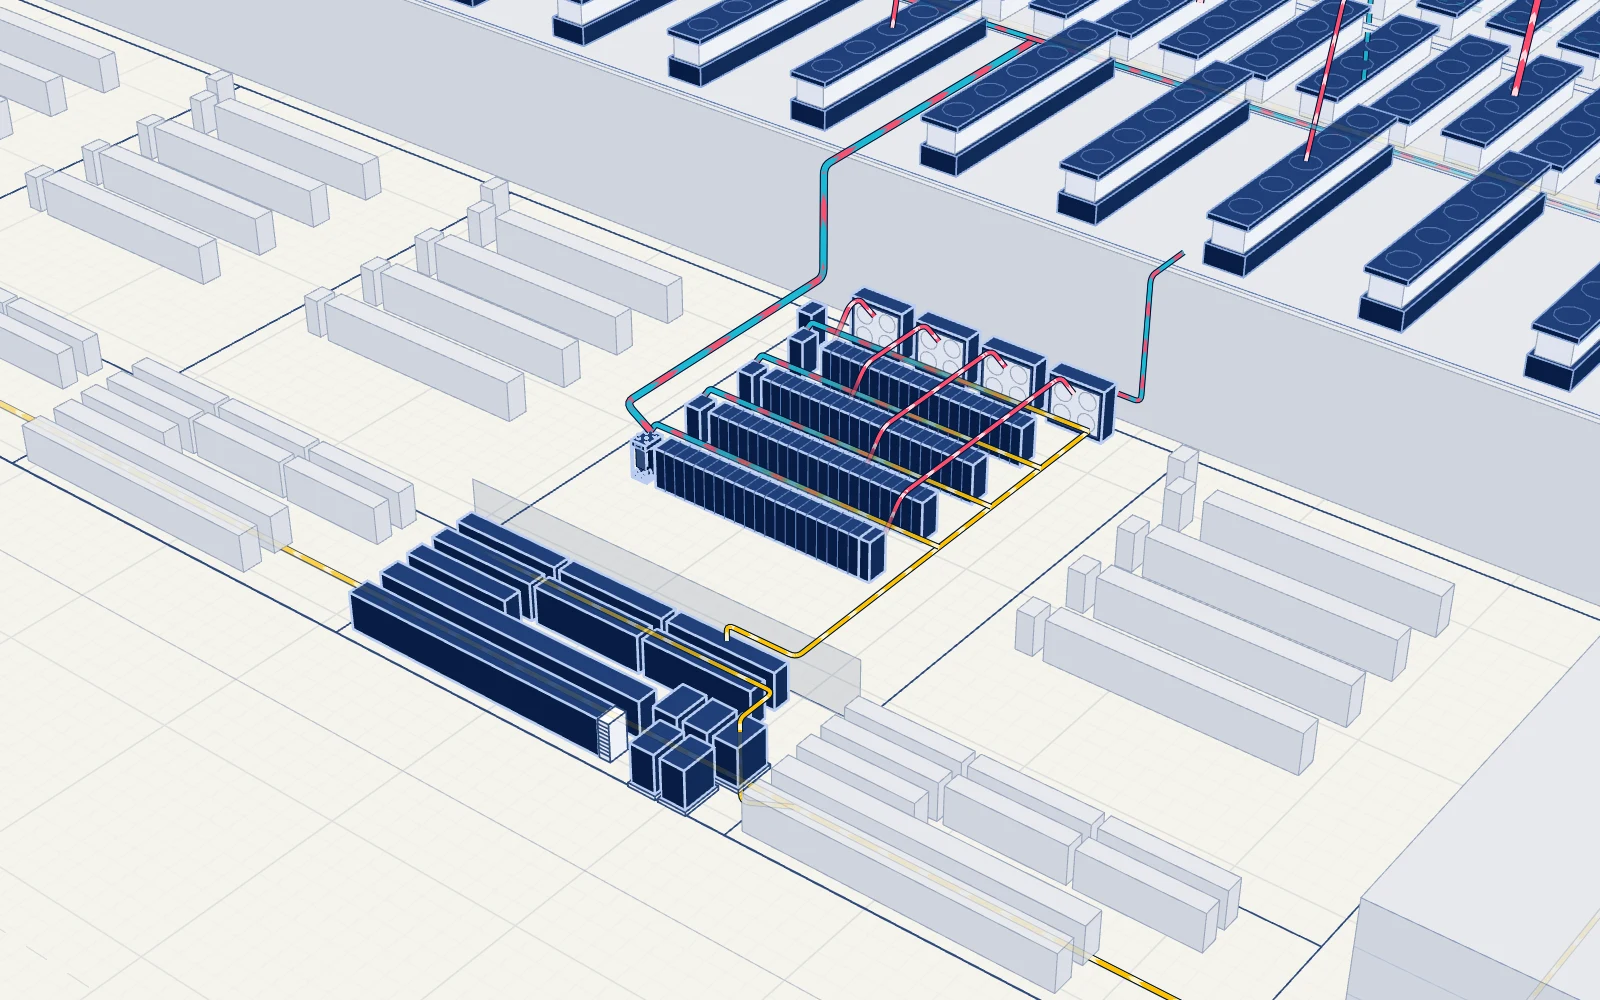
The roof is lifted off one hall. Power arrives along bars overhead. Liquid is piped to every rack.
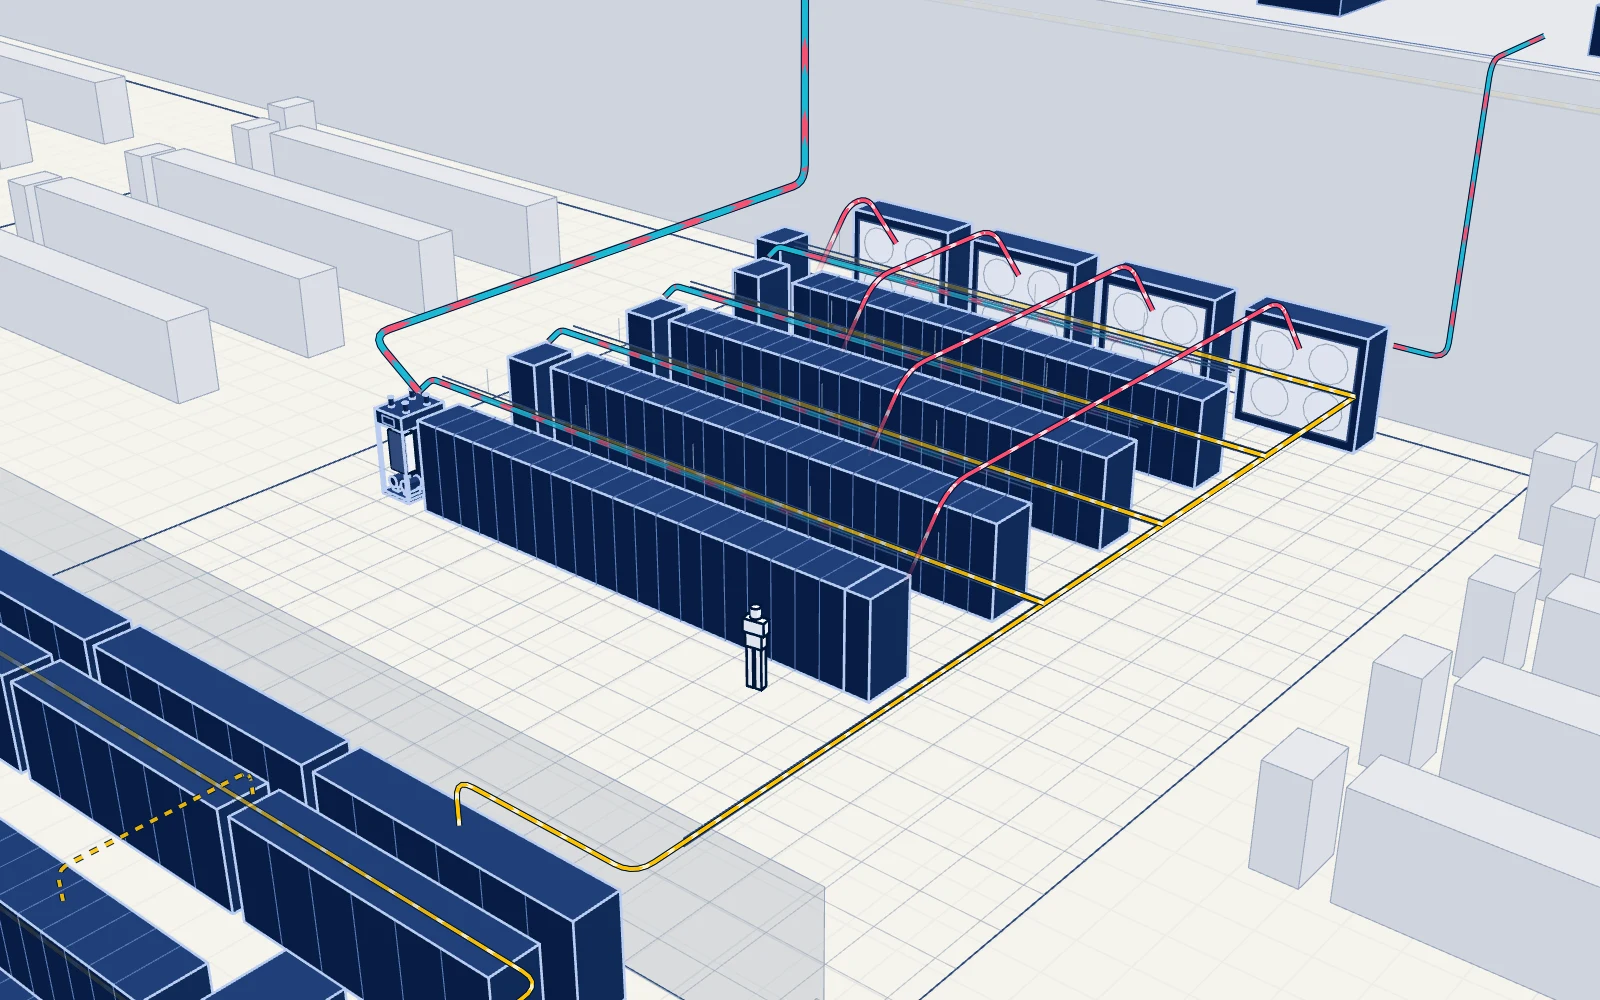
That is as much as 13 ordinary racks. Air alone cannot carry that much heat away, so liquid does most of the work.
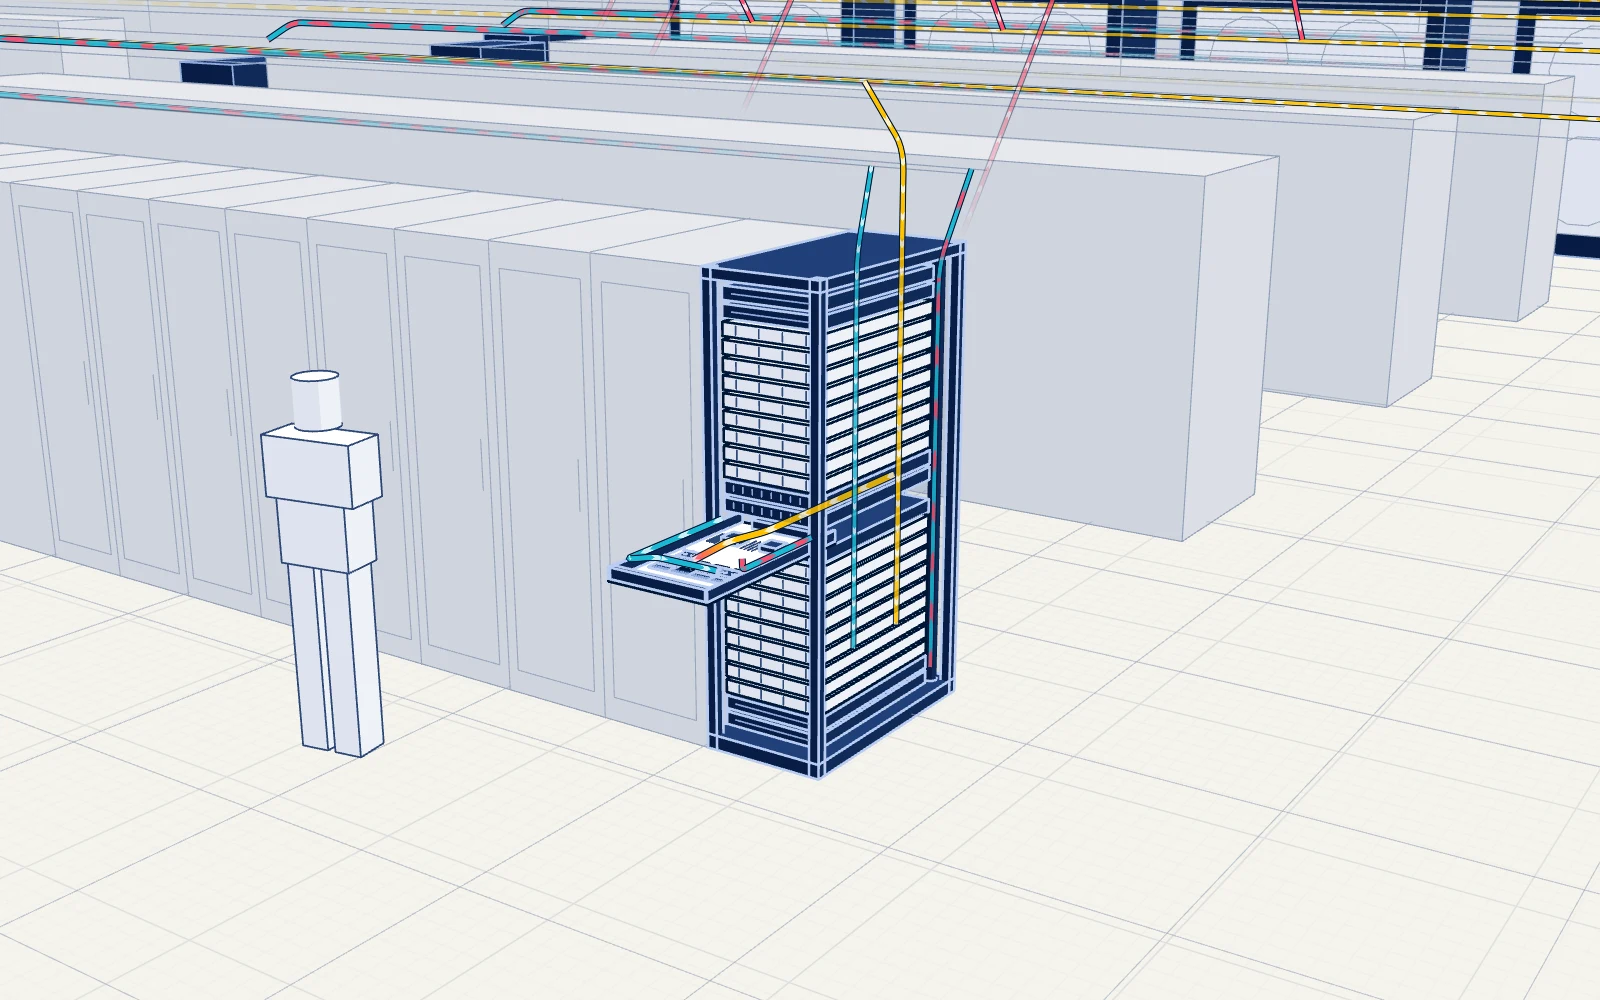
Trays of graphics cards, the switches that link them, and the power and coolant they need.
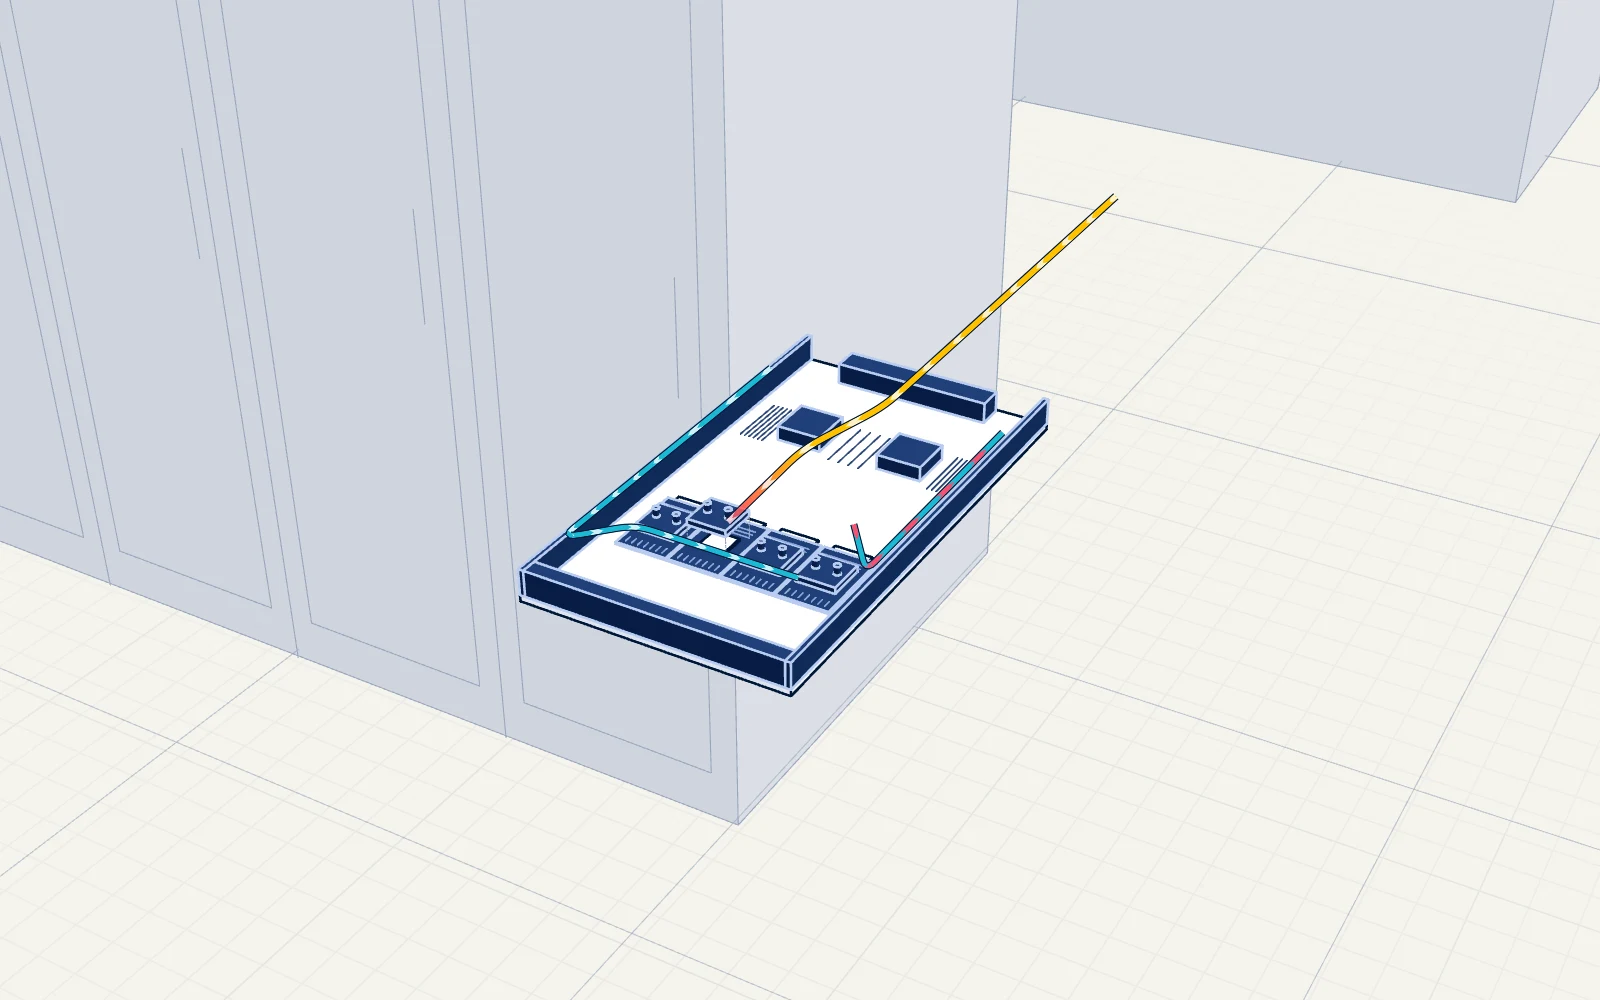
A tray of cards, slid out. This rack keeps its cards in trays like this one, not in separate servers. Each card sits under a metal plate with liquid running through it.
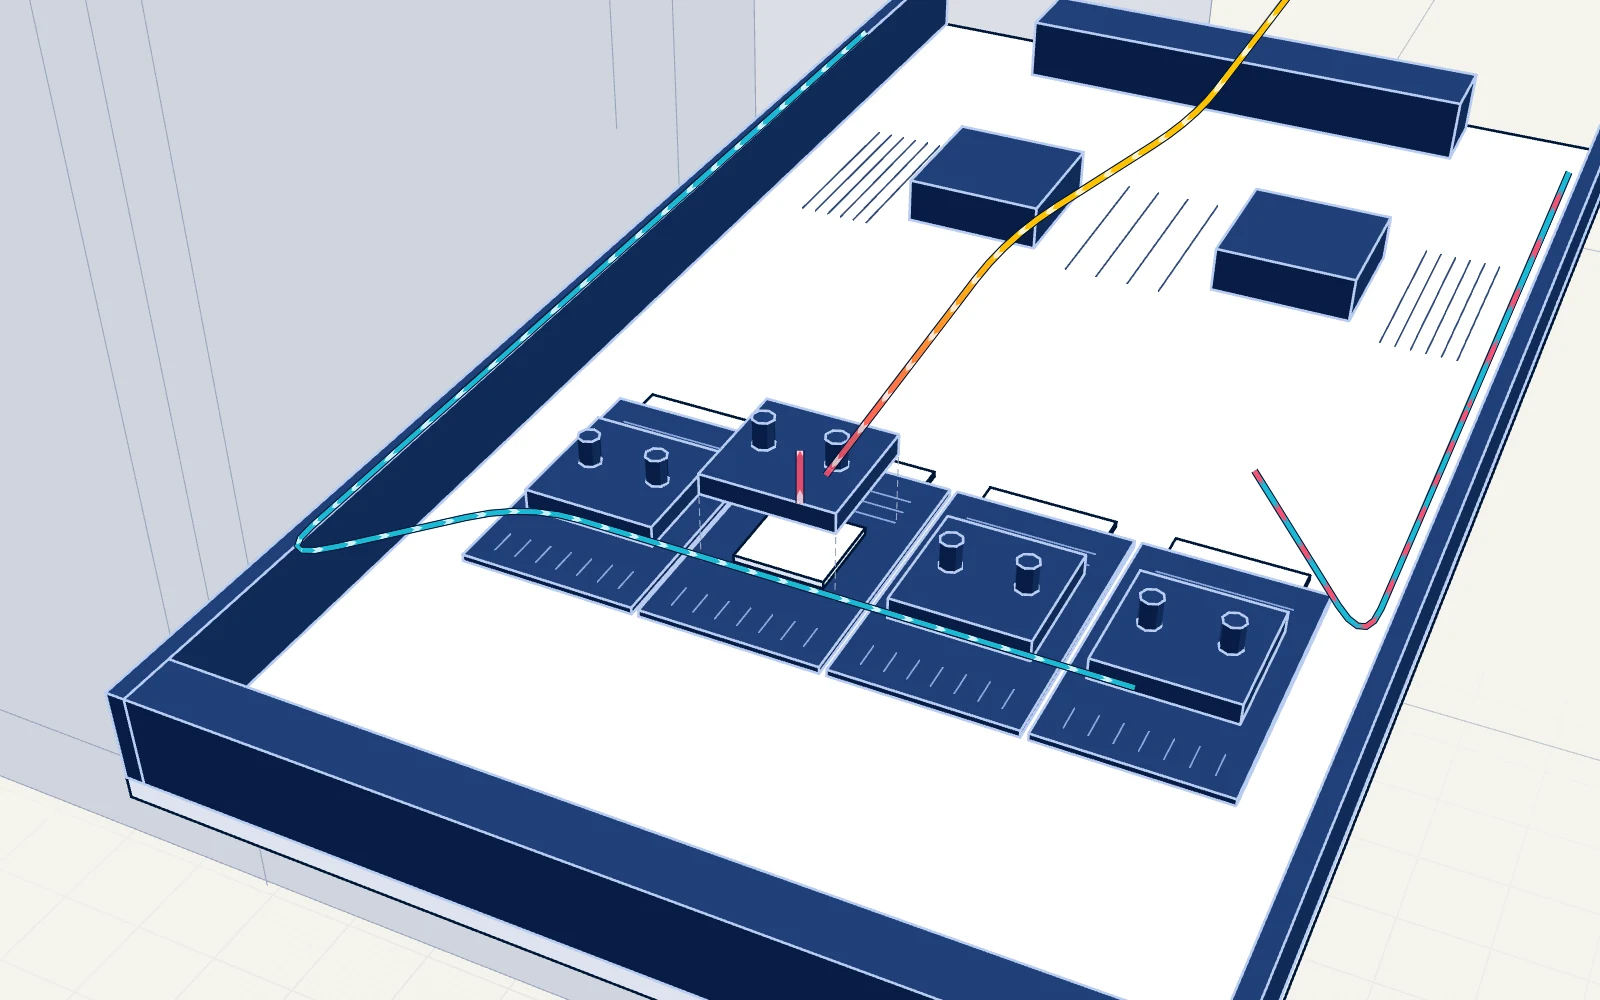
This is where the electricity is used. Nearly all of it comes straight back out as heat, into the plate lifted above the chip.
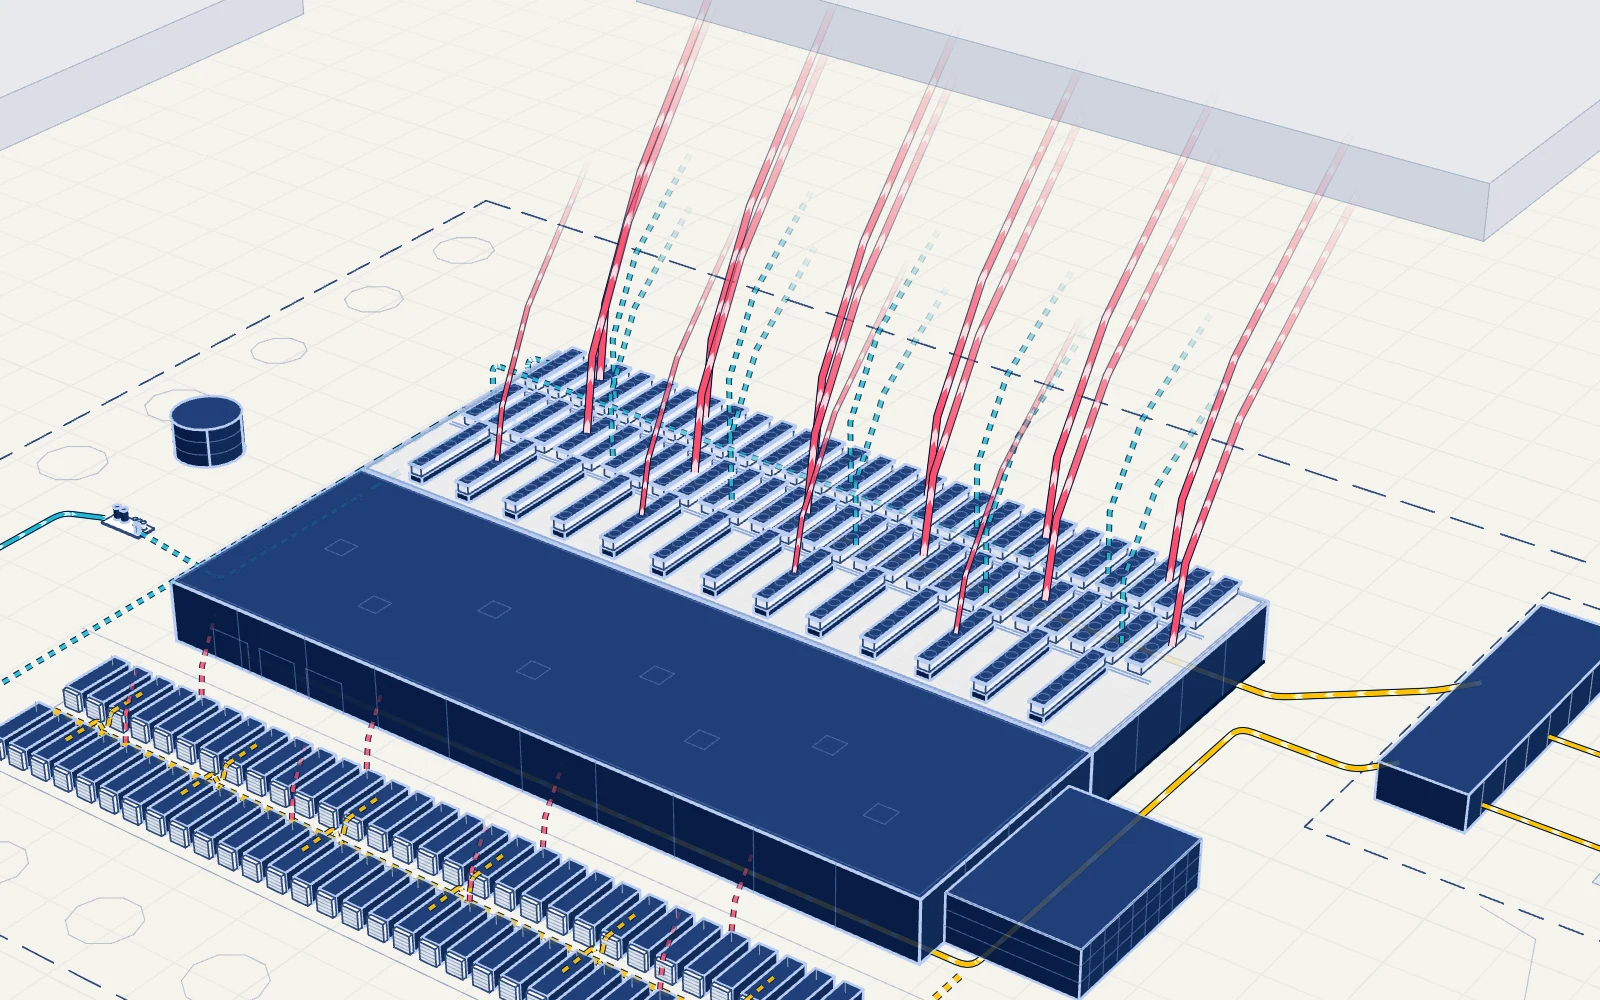
The liquid carries the heat up to the roof, and outdoor coolers hand it to the air. Everything that came in as electricity leaves here as warm air.
The liquid carries the heat up to the roof, and cooling towers let it go, mostly by evaporating water. Everything that came in as electricity leaves here.
The grid, the water, the fibre and the land.
Electricity is made a long way off and comes in on tall transmission lines to terminal stations on the edge of the city. A site this size wants to be close to one. On rural and growth-zone land the planning rules now ask for a high-voltage line or substation within 5 km, or another test to be met.
One proposed Australian AI data centre connects at 220 kV.
That is 11 projects, about 121 MW each. Our indicative site is built for 120 MW, so it would be an average one in that queue.
A Melbourne network planner discounts what data centres ask for by 30%. New sites take 3 to 4 years to grow into their connection.
Water arrives the way it does for every house: from reservoirs, through big mains, to the street. Data centres draw less than 1% of the drinking water today. Last year 13 of them in one water corporation's area used 33 ML between them.
What is being asked for is far larger: 19 applications in the same area seek 19,714 ML a year. Applied for is not approved, and not used. Victoria now expects new sites to be designed to 1.0 L/kWh or less on drinking water.
Our indicative site would use about 61 ML a year. An estimate.
Data travels on glass fibre, shown here as dotted lines. The state points to dense fibre networks, nearby landing points for undersea cables and internet exchanges as reasons to build in Melbourne.
A study for three network businesses counted 41 the year before. The two counts use different lists.
A study for three network businesses says industrial land west of the city centre suits data centres: affordable, connected, with more vacant space. The state says data on transport, energy and water will help decide where new ones go.
For comparison, one Sydney campus sits 21 m from its nearest home. One proposed Australian AI data centre is 1.4 km from the nearest homes.
Building is the quick part. The wait is for the grid: a large power transformer can take up to 4 years to obtain, and their price has risen 75% in a few years.
One Sydney campus allows 54 months to build.
From the grid to one graphics card.
A data centre is described by what it is built for. What it draws is lower. A national laboratory in the United States assumes AI servers at work draw 60 to 80% of their rating. We used 70%. No public source gives metered figures for an AI site.
Of that, 100 MW is for the computers. The other 20 MW runs the cooling or is lost on the way.
Of that, 70 MW reaches the computers. The other 14 MW runs the cooling or is lost on the way.
Built for 50,000 kettles boiling at once.
About 35,000 kettles boiling at once, all day and all night. Over a year that is the electricity of about 184,000 households.
Steps the grid's high voltage down to a voltage the site's own cables can carry.
Banks of heavy switches that route power around the site and cut it off in a fault.
Beside every hall, smaller transformers step the power down again. Each is rated 2,500 kVA and weighs 5,280 kg. From here the power passes the batteries and goes out along the overhead bars.
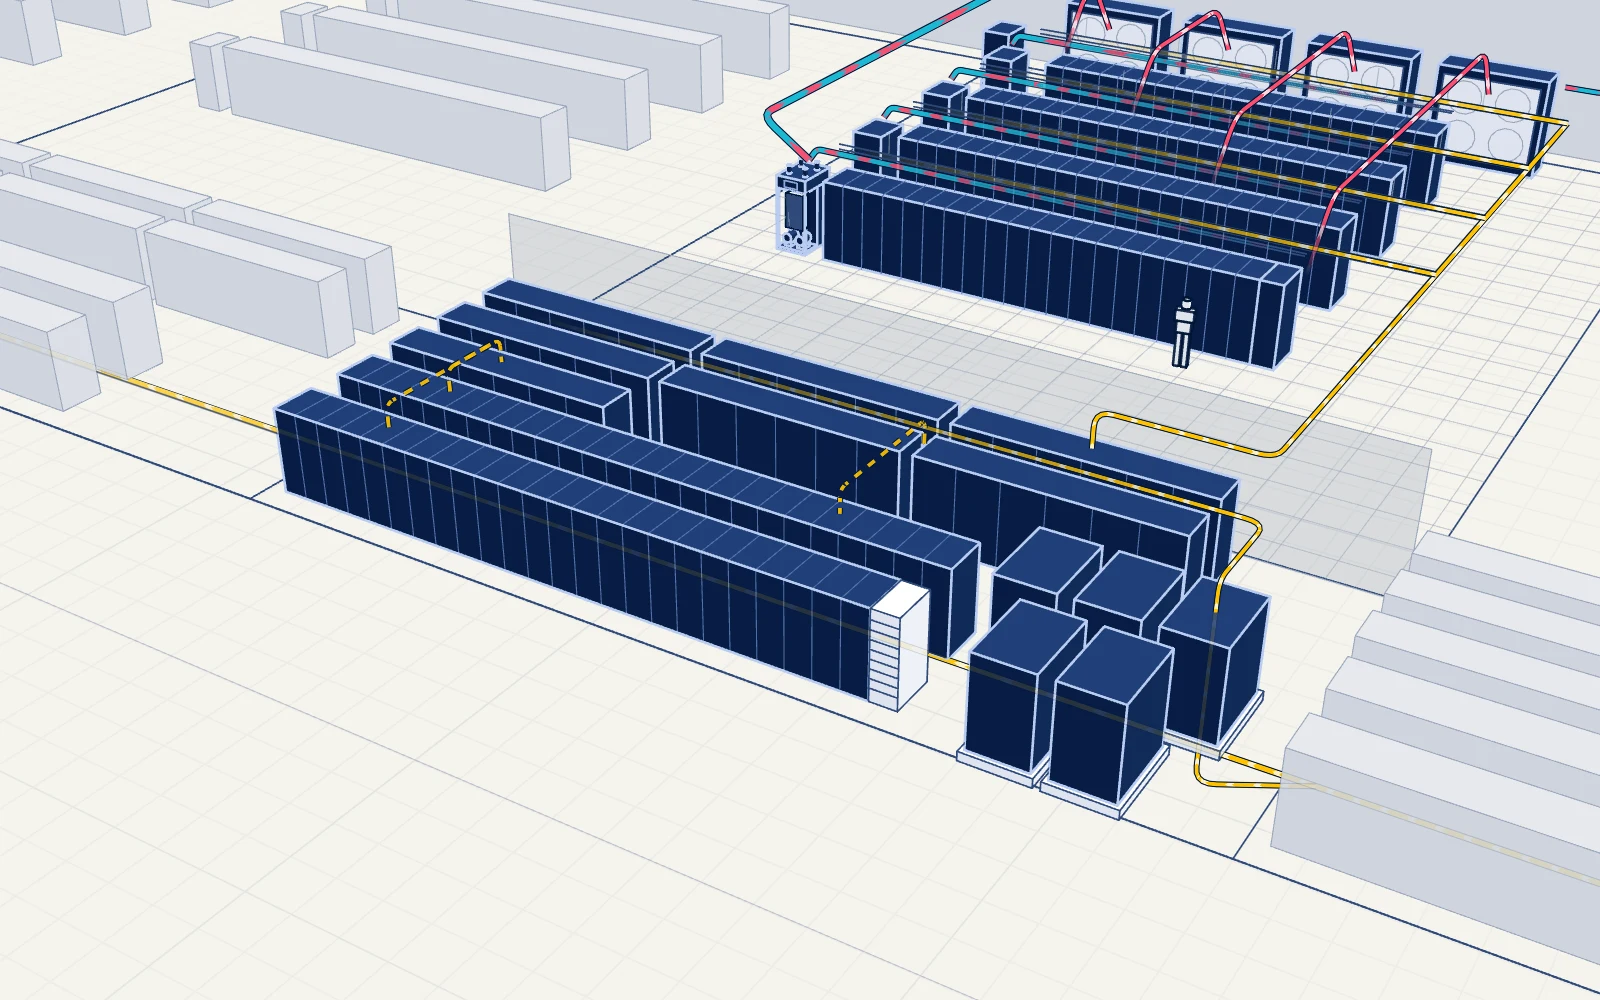
Keeps the computers running for the few minutes between the grid failing and the generators taking the load.
Overhead bars carry power along the row. A shelf in each rack turns it into the low-voltage direct current the servers use.
A steel frame holding trays of graphics cards, the switches that link them, and the power and coolant they need.
A computer built around eight graphics cards, with ordinary processors, memory and network cards to feed them.
The chip that does the AI arithmetic. Nearly all the electricity it takes in comes out as heat.
From the card, through the cooling, to the sky.
Nearly all the electricity computing equipment uses becomes heat. That is the whole job of the building: bring electricity in, and carry the same amount of heat away.
About what a toaster draws: 600 to 1,000 W.
A metal plate sits on each chip with liquid running through it. Liquid carries about 1,000 times more heat than air, which is why racks this dense are cooled this way.
Sits between the building's water and the racks' own coolant. It pumps coolant to the chips and passes their heat across without the two liquids mixing.
The coolant units hand the heat to a second loop of water, which runs up to the roof and back. The two liquids never mix. On the drawing, cyan banded with red is water carrying heat.
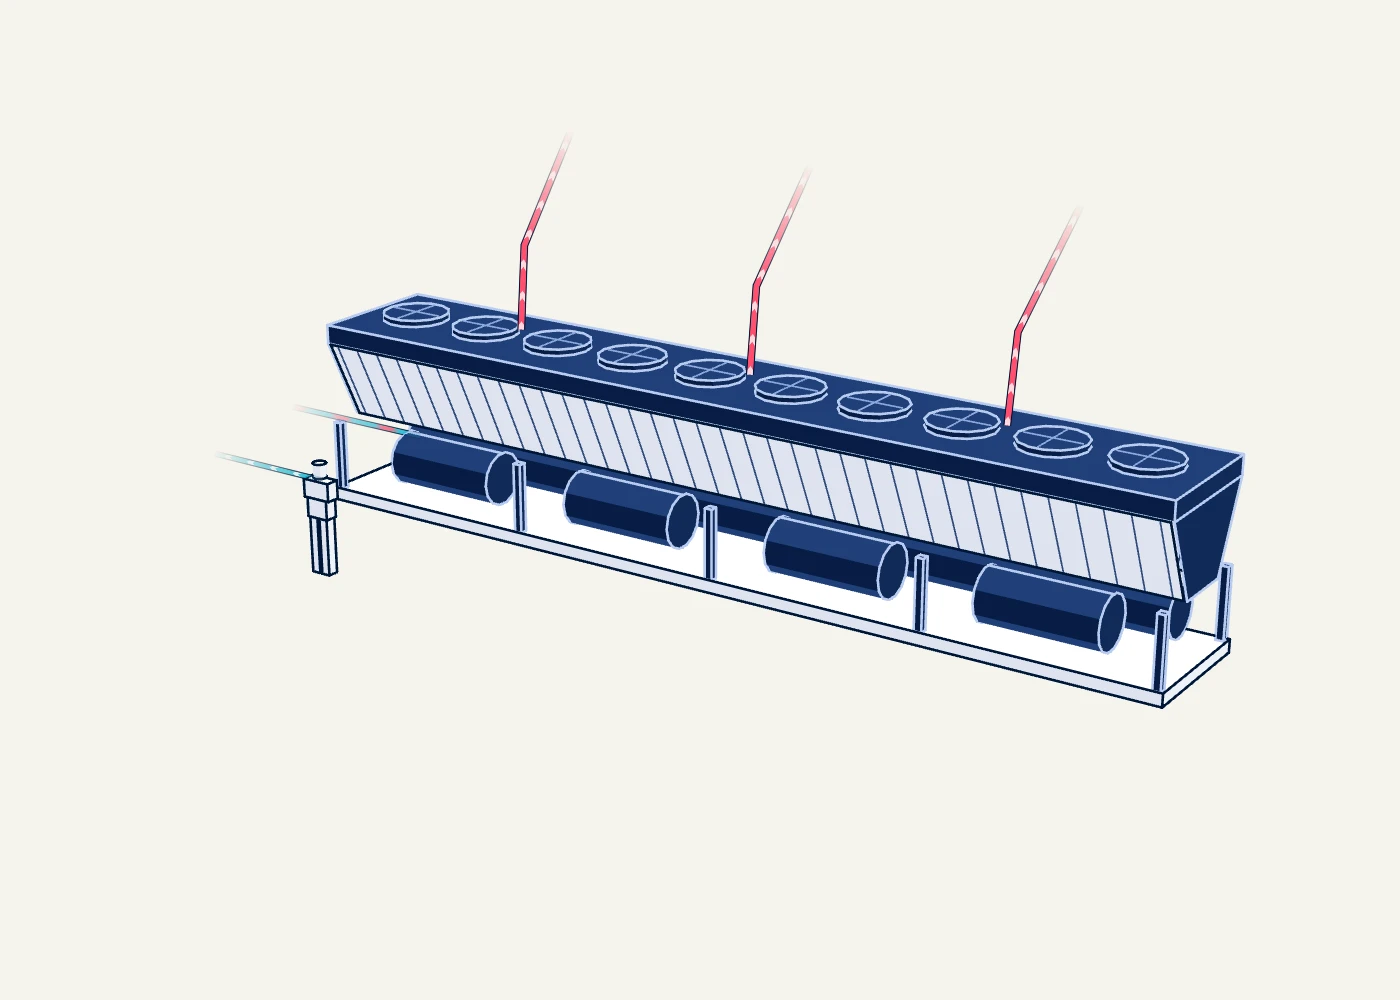
A long bank of fans and coils that gives the liquid loop's heat to the outside air. On hot days it wets the incoming air to cool it first.
Liquid does not catch everything. A fan wall draws the warm air off the racks and passes it over chilled water. Chillers on the roof take it from there: 13 of them, for 20 MW of heat across the site.
That accounts for the computers' 100 MW: 80 MW in liquid and 20 MW in air. The rest of the site's 120 MW of heat is the cooling plant's own, and what the electrical gear loses, and it leaves where it is made.
In from the main, round the plant, and out.
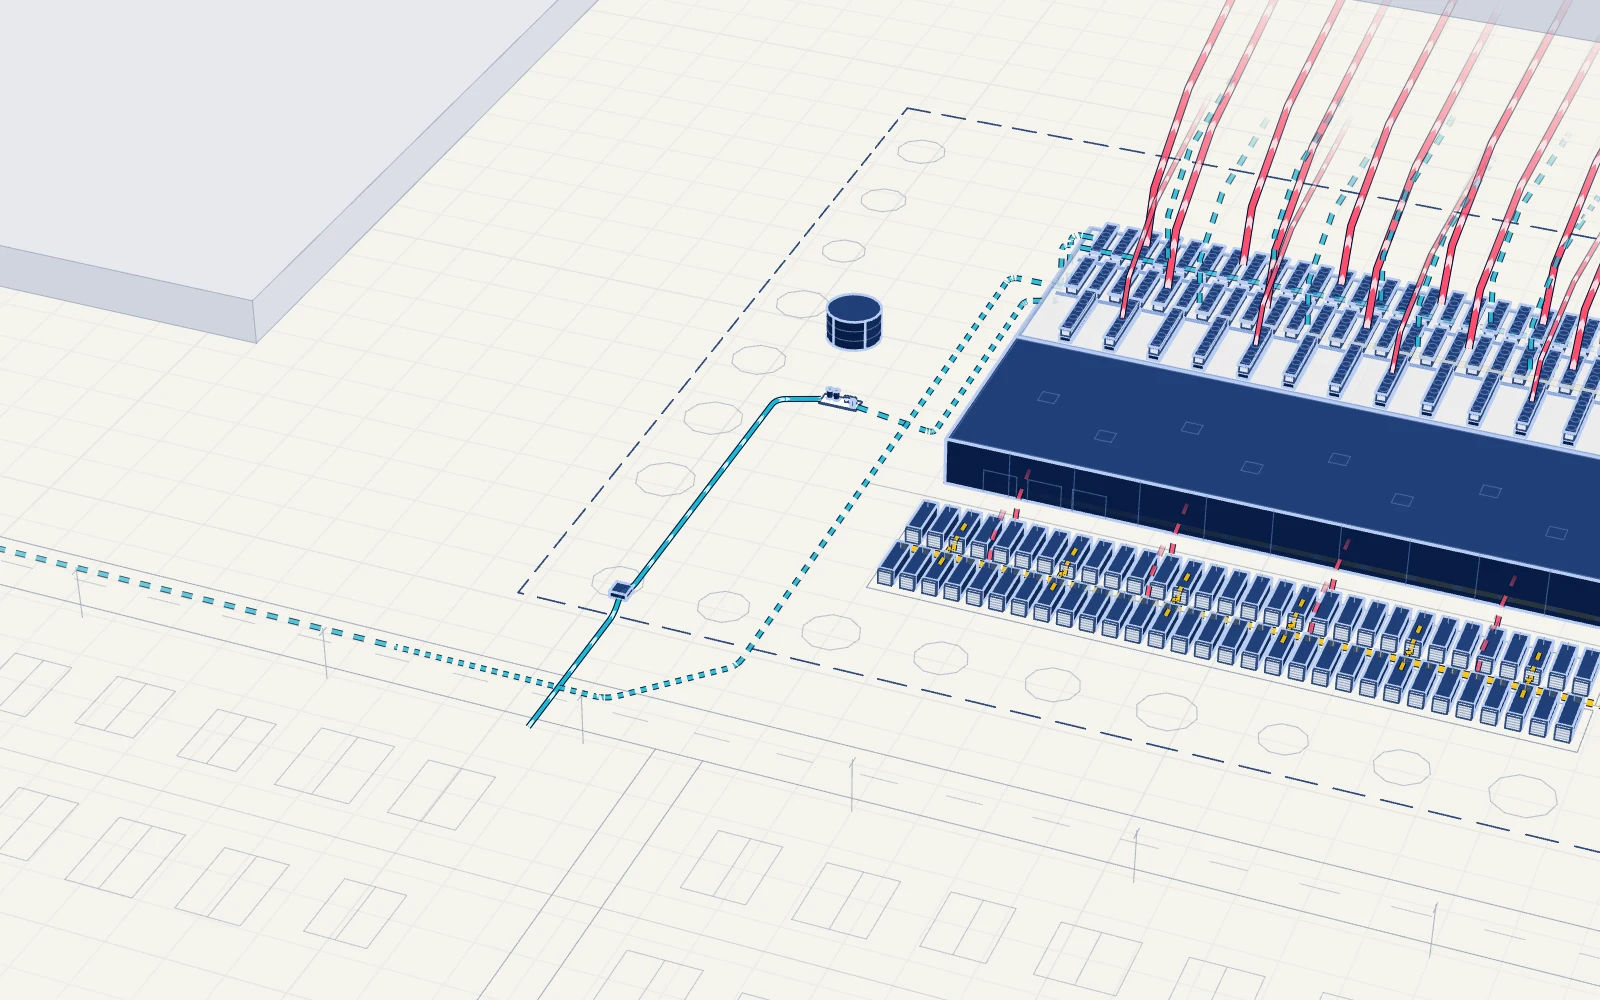
Water comes from the same main as the street. This design uses little. The figure is our estimate for a year with every hall running flat out. Published water ratios for designs like this run from 0.01 L/kWh to 0.7 L/kWh, and no public source gives one for Melbourne's summers.
Water comes from the same main as the street. This design uses little: about 170 kL a day, averaged over the year. The figure is our estimate. Published water ratios for designs like this run from 0.01 L/kWh to 0.7 L/kWh, and no public source gives one for Melbourne's summers.
With cooling towers the same site would draw about 870 ML a year from the main. That uses the water ratio a United States national laboratory calculated for its own liquid-cooled hall on towers alone.
Victoria now expects new sites to be designed to 1.0 L/kWh or less on drinking water.
About 20 Olympic pools a year, or what 380 Melbourne households use.
Filters and doses the cooling water so it does not scale, corrode or grow bacteria.
Most of the year the outdoor coolers run dry: fans and warm liquid, nothing else. On hot days they wet the incoming air to cool it first. That is the only time this design uses water for cooling.
Cooling towers use water all year: evaporating it is how they work. Hot days only make them use more.
One proposed Australian AI data centre with dry coolers expects to use 0 to 22,000 kL a year. It is in a cooler climate than Melbourne's.
At one proposed Australian AI data centre, 90% of the cooling water evaporates. On our indicative site, of the 61 ML used in a typical year, that is 55 ML into the air and 6 ML to the sewer, drained so minerals do not build up.
A cooling tower sheds heat by evaporating water. The rest is drained to the sewer so minerals do not build up. We have no sourced split for this site on towers.
With the dry coolers drawn here, the same site uses 61 ML in a typical year. Switch the cooling design and watch the roof and the water line change. Cooling towers use less electricity and far more water. Dry coolers use almost no water and more electricity. Dry coolers suit a cool climate better than a hot one, so the Melbourne water figure is the weakest in this drawing.
Not found for the tower design: its efficiency ratio, how many towers this site would need, and its water use at built capacity. The towers on the drawing show the kind of plant, not a count.
Batteries, then generators, then fuel.
The gold line from the grid breaks into dashes: it is carrying nothing. Nothing in the halls notices: batteries between the grid and the racks take over in the same instant.
Keeps the computers running for the few minutes between the grid failing and the generators taking the load.
A diesel engine the size of a truck, driving an alternator. It sits still unless the grid fails or it is being tested.
Holds the diesel the generators would burn in a long blackout.
When the grid is steady again the site moves back to it, the generators stop and the batteries recharge. Most generators only ever run for testing: one United States rule limits that to 100 hours a year.
A hall, a rack, a server, a card.
An AI hall is small and dense. This one is built for 10 MW of computing. The racks stand in rows. Power comes along bars overhead, and liquid is piped to every rack.
A steel frame holding trays of graphics cards, the switches that link them, and the power and coolant they need.
A computer built around eight graphics cards, with ordinary processors, memory and network cards to feed them.
The chip that does the AI arithmetic. Nearly all the electricity it takes in comes out as heat.
Hair-thin glass that carries data as light between the graphics cards, so thousands of them can work as one machine.
The parts, the time and the cost.
Every piece of plant on the drawing is counted, and each count is worked out from what the site is built for. Tap a number plate to open that piece of equipment.
What it takes to keep 60,000 graphics cards running. Each line opens that piece of equipment.
Building is the quick part. The wait is for the grid: a large power transformer can take up to 4 years to obtain, and their price has risen 75% in a few years.
One Sydney campus allows 54 months to build.
Two Sydney campuses work out at 6.2 A$m/MW and 10.8 A$m/MW. Applied to this site, that is the range above. Neither source says what its cost covers. At one of the two, the tenants supply the computers, and no public record prices them.
No public source prices a generator, a transformer, a server or a graphics card, so no item on this drawing has a price.
It takes far more people to build a data centre than to run one. The same Sydney campus, built for 294 MW, expects 411 operating jobs. One proposed Australian AI data centre plans for 70 staff on its day shift.
Dry coolers. The indicative design: liquid to the chips, and coolers on the roof that are wetted only in hot weather.
Cooling towers. The other design: less electricity, far more water. The number of towers drawn is not a sourced figure.
Steps the grid's high voltage down to a voltage the site's own cables can carry.
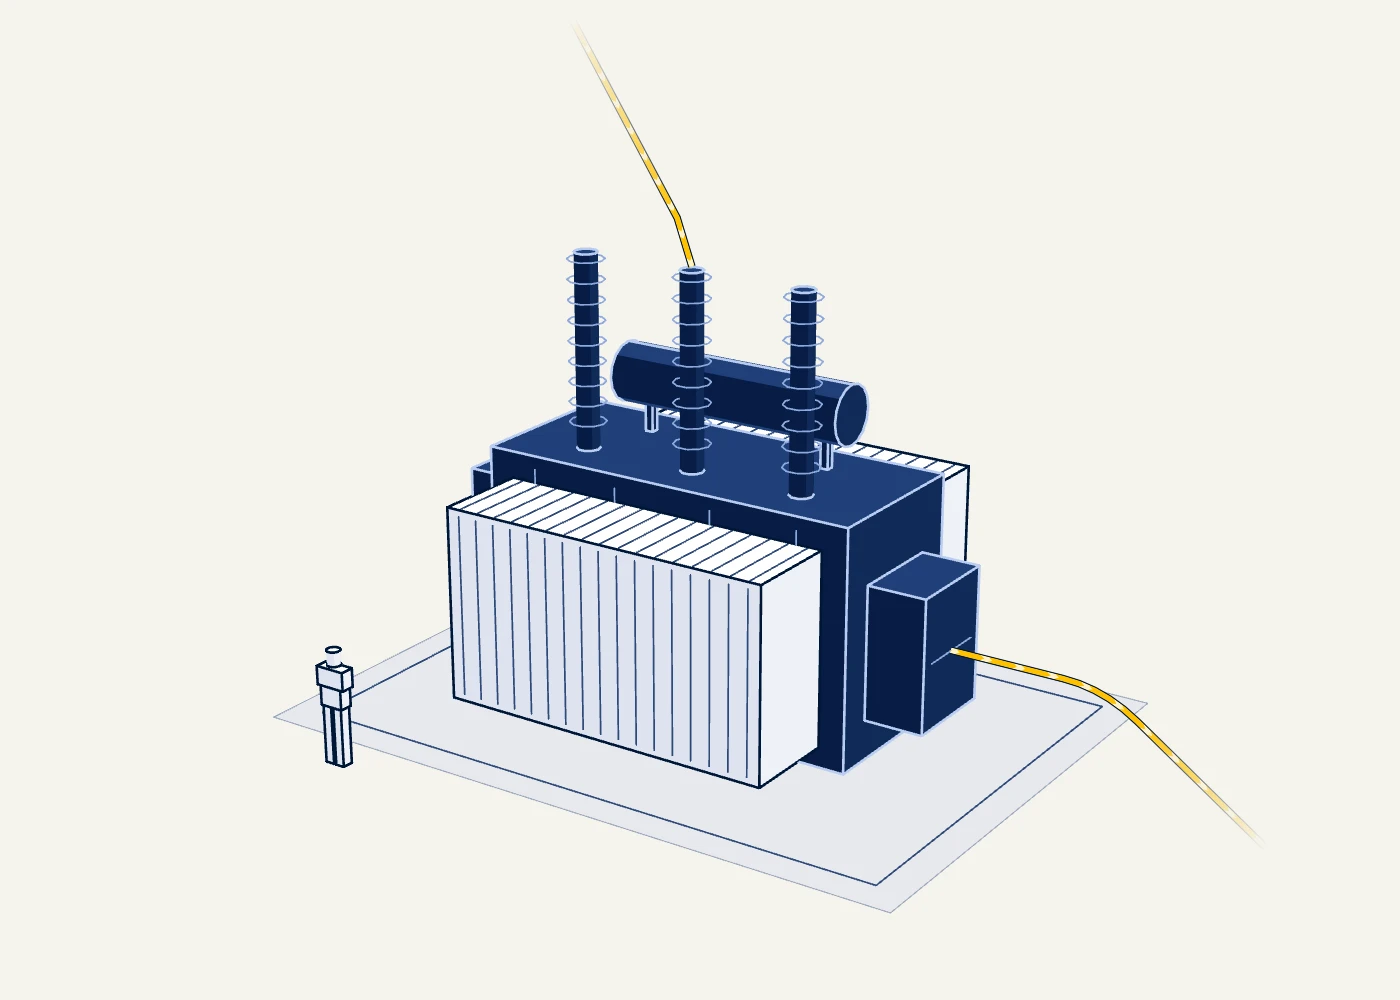
Enough to carry 120 megawatts, plus one spare.
If it stops: The others carry the load: the site has one more than it needs, so any one can be taken out.
| Rated for | 60 to 90 MVA | Built for | |
|---|---|---|---|
| Length | 7,800 mm | Size | |
| Width | 5,600 mm | Size | |
| Height | 6,800 mm | Size | |
| Weight | 106 t | Weight | As heavy as 2.9 shipping containers loaded to their limit. |
| Grid voltage at one Sydney campus | 330 kV | ||
| Wait to get one, up to | 4 years |
Figures are one maker's, for a lower grid voltage than Melbourne's. No data sheet for Australian voltages was found.
Not found
Banks of heavy switches that route power around the site and cut it off in a fault.
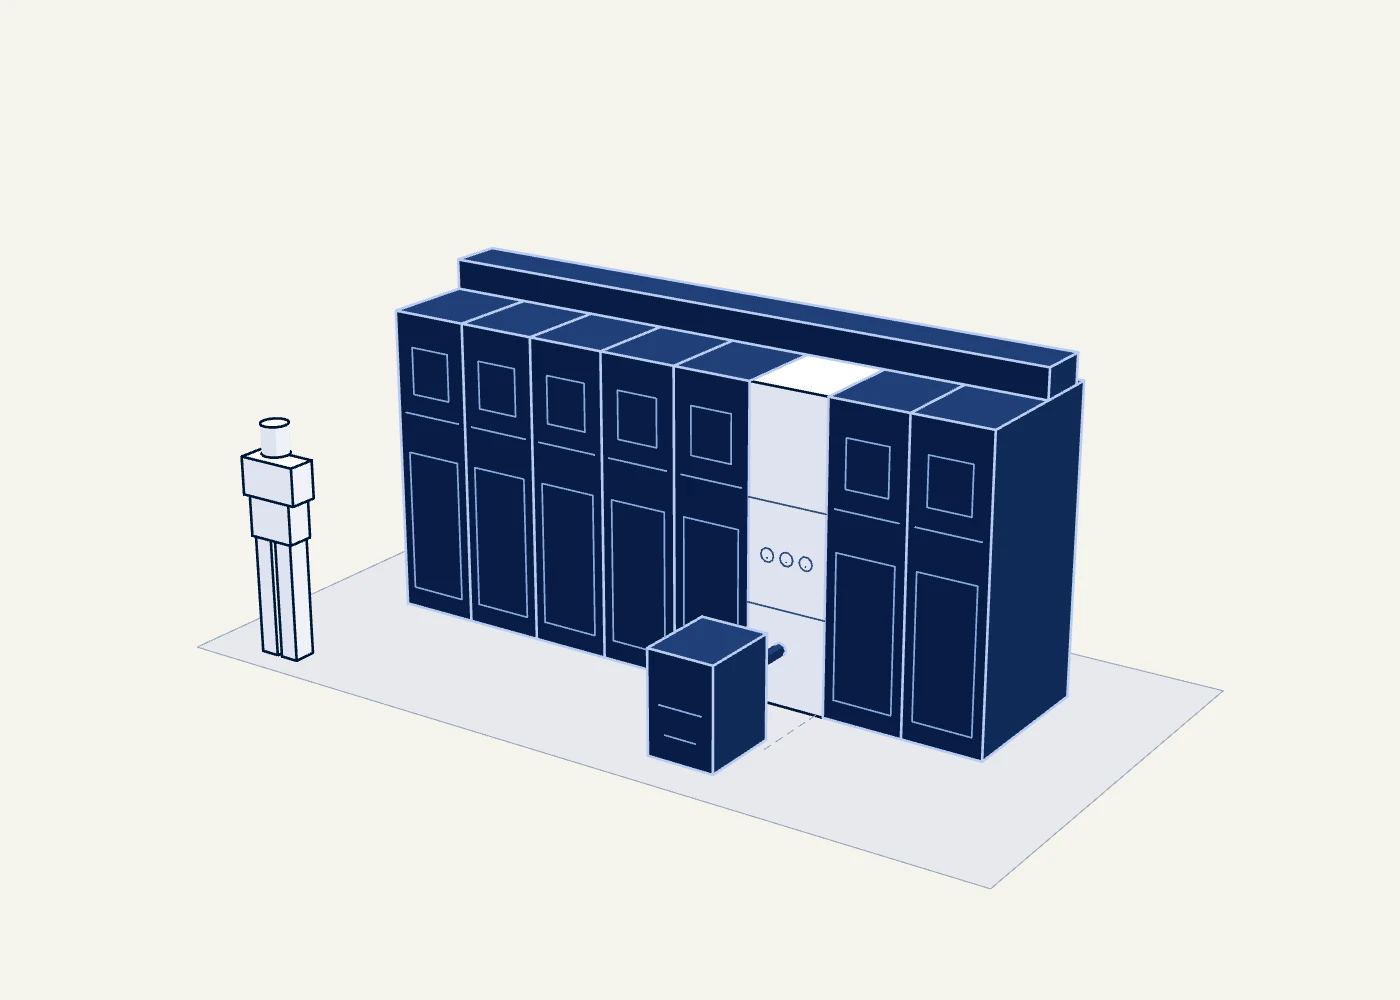
Not counted: no public source gives the number of panels for a site of a stated size.
| Rated for | 36 kV | Built for | |
|---|---|---|---|
| Carries up to | 2,500 A | Built for | |
| Depth of one panel | 1,225 mm | Size | |
| Height of one panel | 2,250 mm | Size | |
| Weight of one panel | 800 to 1,400 kg | Weight |
Not found
Keeps the computers running for the few minutes between the grid failing and the generators taking the load.
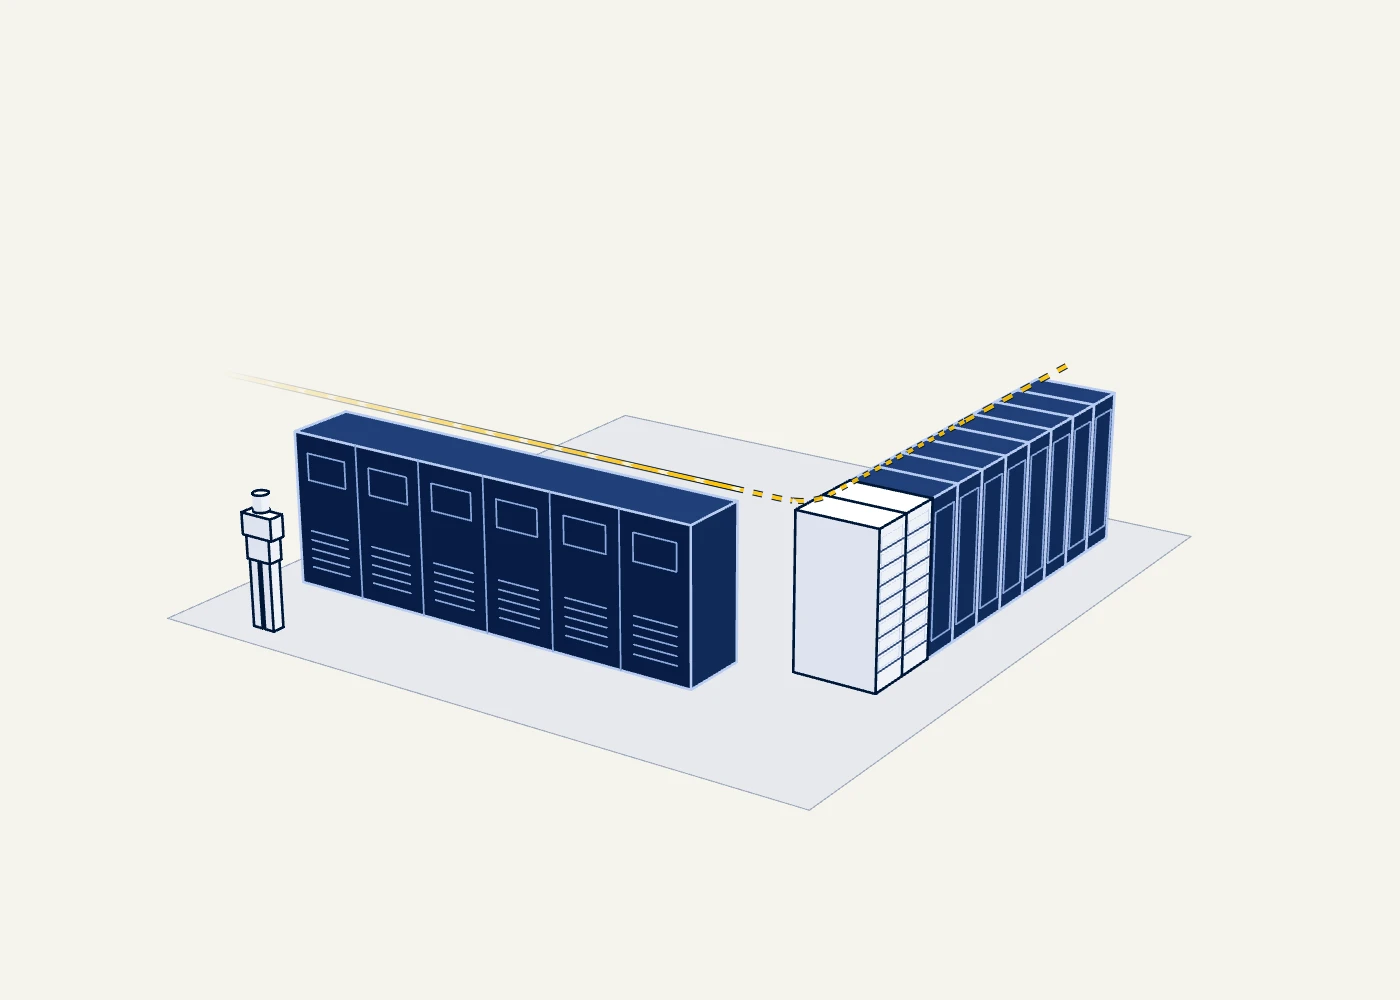
Enough cabinets to deliver 100 megawatts, before spares. They feed 67 power units: the cabinets of electronics that switch the computers over to the batteries.
If it stops: The computers it feeds would stop the instant the grid dropped. Some AI training halls accept that, and leave the batteries out.
| Carries the load for | 5 minutes | Built for (5 to 16.1) · Single source | |
|---|---|---|---|
| One power unit is rated for | 1,500 kW | Built for | |
| Width of one power unit | 5,900 mm | Size (5,600 to 6,250) | |
| Height | 2,000 mm | Size (1,970 to 2,100) | |
| Weight of one power unit | 4,700 kg | Weight (4,116 to 5,200) | |
| Passes through | 95 to 96% | Running at | |
| One battery cabinet delivers | 200 kW | Built for (184 to 210) | |
| One battery cabinet holds | 51.2 kWh | Built for | |
| Weight of one battery cabinet | 650 kg | Weight (490 to 800) | |
| All the cabinets together hold | 25.6 MWh | Built for | As much as 840 home batteries. |
| Batteries at one Sydney campus | 777,600 kg | Weight |
One proposed AI site has no battery room: each generator has its own battery pack beside it.
Not found
A diesel engine the size of a truck, driving an alternator. It sits still unless the grid fails or it is being tested.
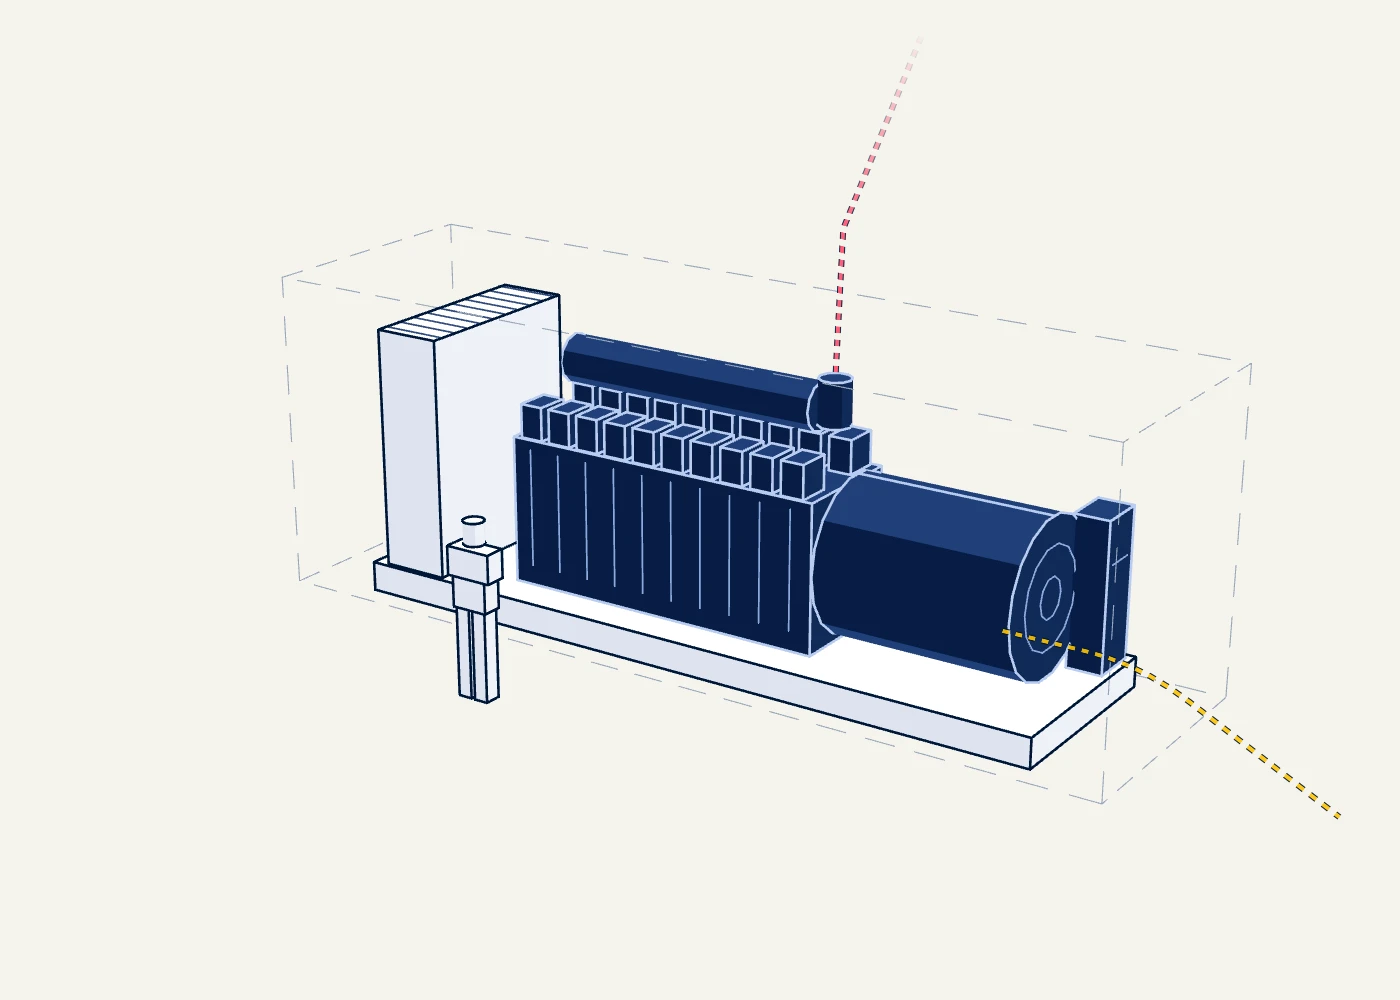
48 are needed to carry 120 megawatts. Twenty are installed for every sixteen needed, which is how one Sydney design loads its generators.
If it stops: Another takes its place: the site installs more than it needs.
| Rated for | 2,500 kW | Built for (2,400 to 2,800) | |
|---|---|---|---|
| Length | 7,400 mm | Size (5,670 to 9,224) | About 1.2 times the length of a twenty-foot shipping container. |
| Width | 2,100 mm | Size (1,887 to 2,305) | |
| Height | 2,800 mm | Size (2,332 to 3,342) | |
| Weight | 20,000 kg | Weight (15,819 to 24,000) | About 56 per cent of the most a loaded shipping container may weigh. |
| Burns at full load | 700 L/h | Uses (569 to 806) | |
| Hours a year it may run for testing (United States rule) | 100 hours |
Real sites for comparison: one Sydney campus has slightly fewer generators for each megawatt, and one proposed Sydney campus has more.
Not found
Holds the diesel the generators would burn in a long blackout.
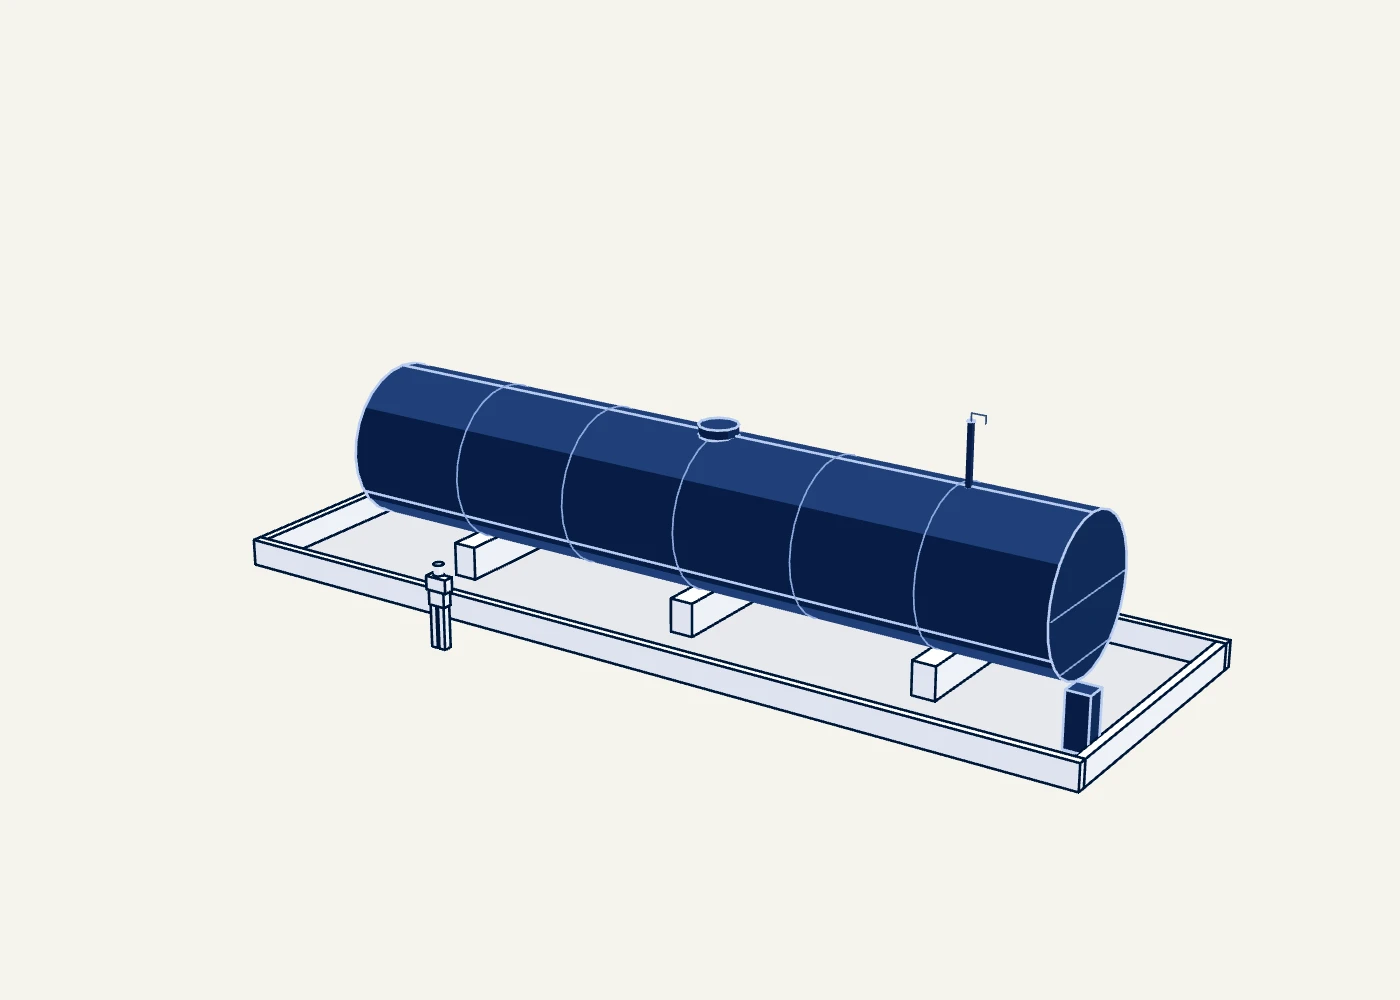
Enough for the 48 generators the site needs (the rest are spares), each burning 700 litres an hour, for 48 hours.
| Diesel on site | 1,600 kL | Built for · Single source | |
|---|---|---|---|
| Enough for | 48 hours | Built for (12 to 48) · Single source | |
| One bulk tank holds | 136 kL | Built for | |
| Or, a tank under each generator | 10,000 L | Built for | |
| The tier standard's minimum | 12 hours | Built for |
Not found
A long bank of fans and coils that gives the liquid loop's heat to the outside air. On hot days it wets the incoming air to cool it first.
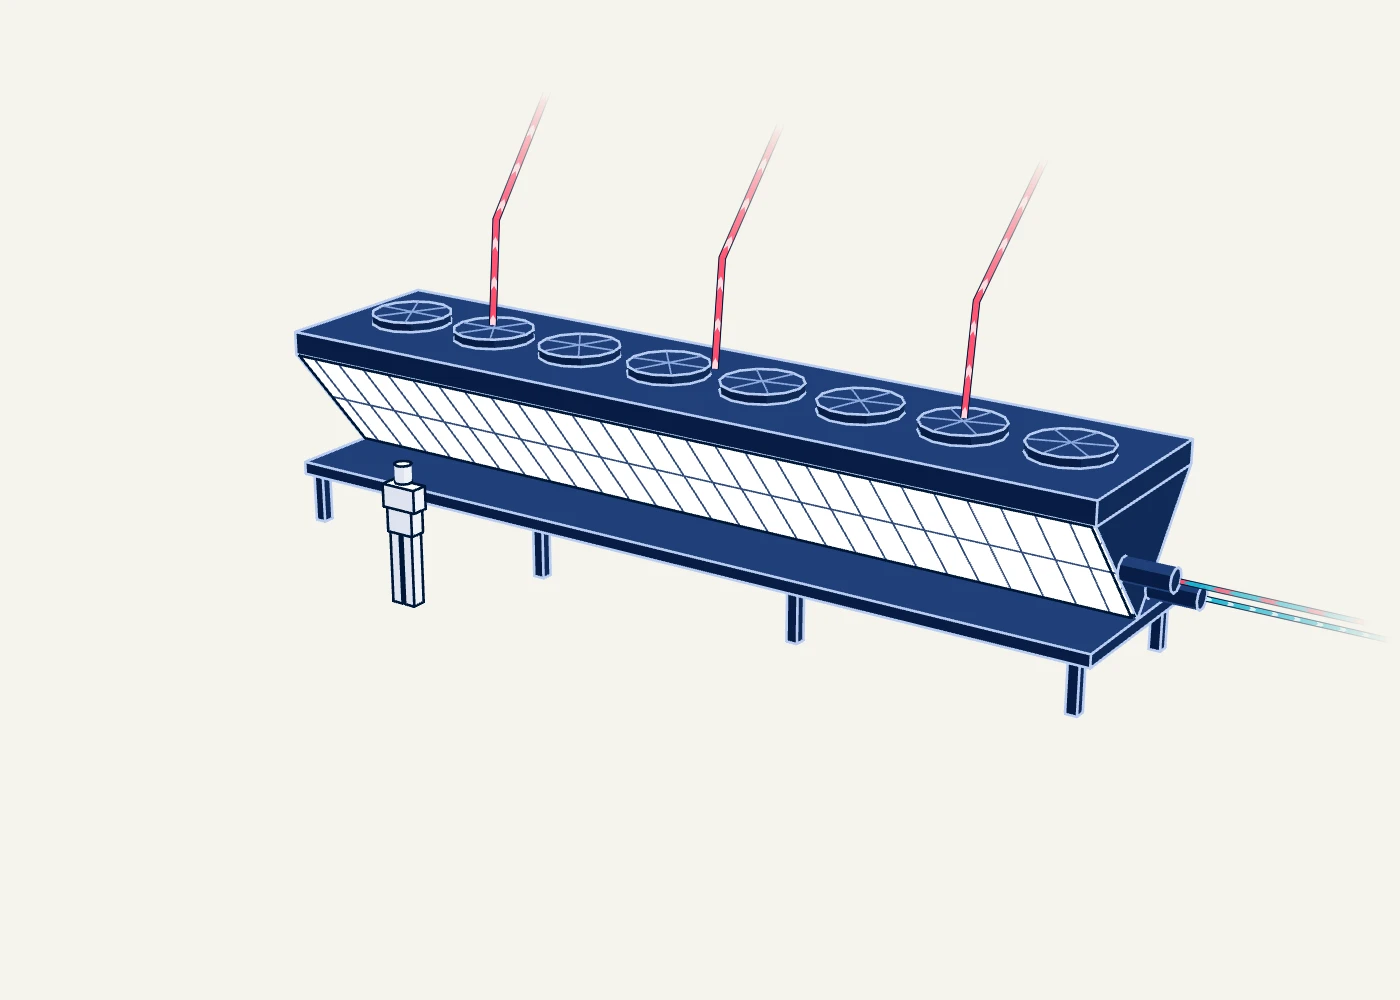
Enough to reject the 80 megawatts the liquid loop carries, before spares.
| Rated to reject | 1,500 kW | Built for (280 to 2,500) | |
|---|---|---|---|
| Length | 11,000 mm | Size (9,098 to 12,613) | About 0.9 times the length of a forty-foot shipping container. |
| Width | 2,382 mm | Size | |
| Height | 2,490 mm | Size | |
| Weight | 9,300 kg | Weight (6,144 to 12,551) | |
| Fans use up to | 74.6 kW | Built for | |
| Coolers at one proposed AI site | 148 | Count |
Not found
A large refrigeration machine. Here it cools the air for the heat the liquid loop does not catch, and backs up the outdoor coolers on the hottest days.
Enough to cool the 20 megawatts of computer heat left in the air, before spares.
| Rated to cool | 1,600 kW | Built for | |
|---|---|---|---|
| Cooling for each unit of electricity | 4.6 | Running at | |
| Length | 14,385 mm | Size | |
| Width | 2,200 mm | Size | |
| Height | 2,900 mm | Size | |
| Weight when running | 18,736 kg | Weight | |
| Chillers at one proposed AI site | 148 | Count |
Figures are one maker's.
Not found
Cools water by letting part of it evaporate. It uses less electricity than a dry cooler and far more water. The indicative site does not have them.
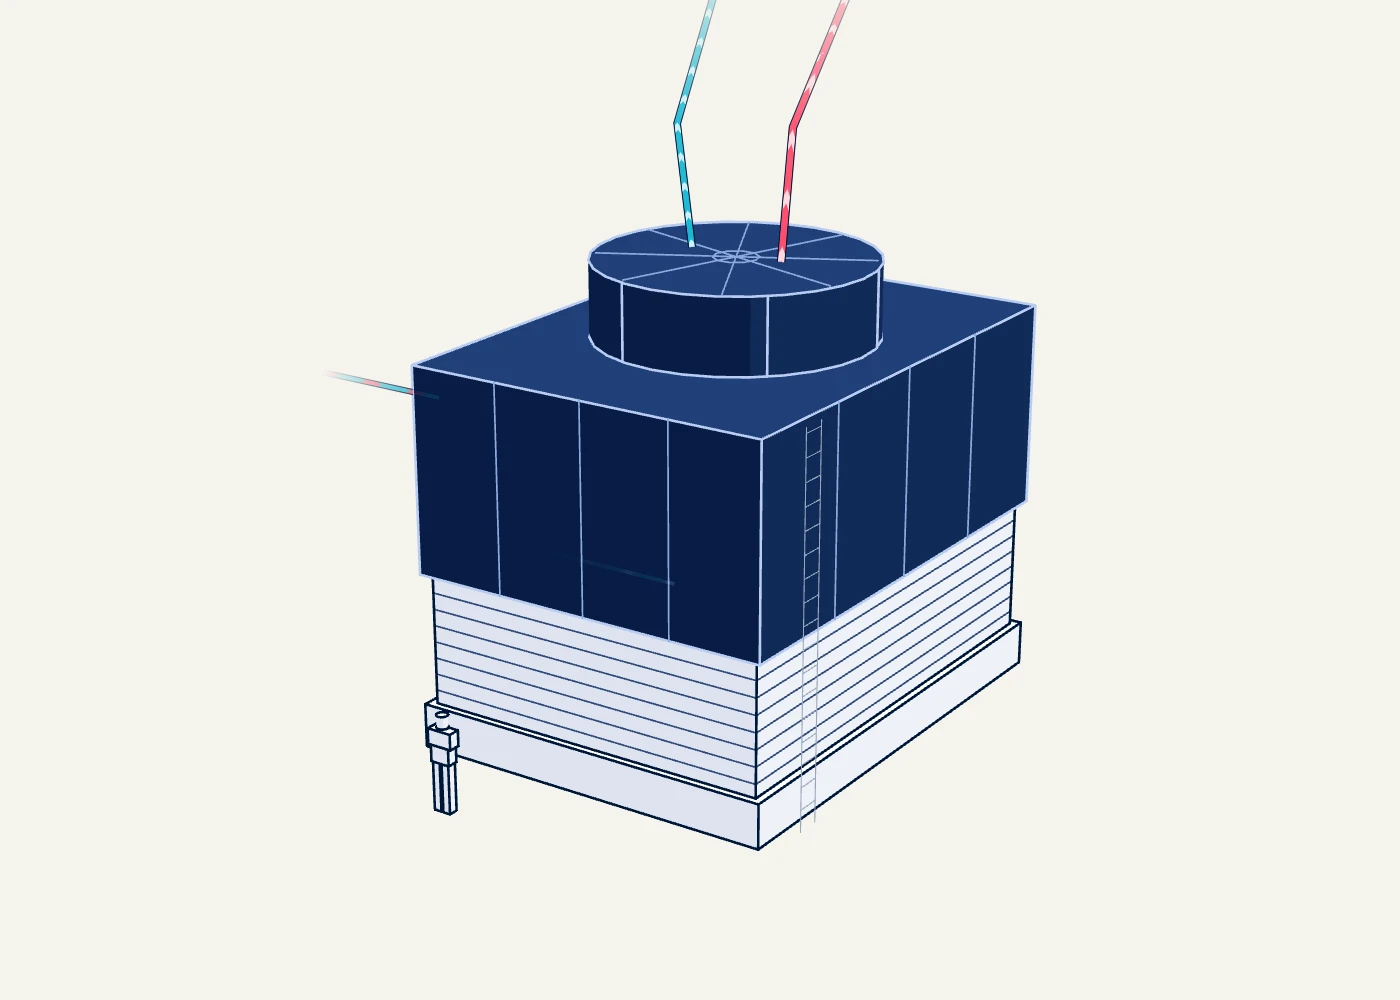
None on the indicative site. Not counted for the other design: no source says how many towers a site this size would need, so the towers on the drawing show the kind of plant.
| Cooling one cell does, in the trade's tons of cooling | 2,189 tons | Built for | |
|---|---|---|---|
| Length | 6,833 mm | Size | |
| Width | 8,992 mm | Size | |
| Height | 8,255 mm | Size | |
| Weight when running | 45,805 kg | Weight | |
| Fan motor | 112 kW | Built for | |
| Water this site would use with towers | 870 ML | Running at · Single source |
In Victoria a cooling tower system must be registered, tested and audited.
Not found
Filters and doses the cooling water so it does not scale, corrode or grow bacteria.
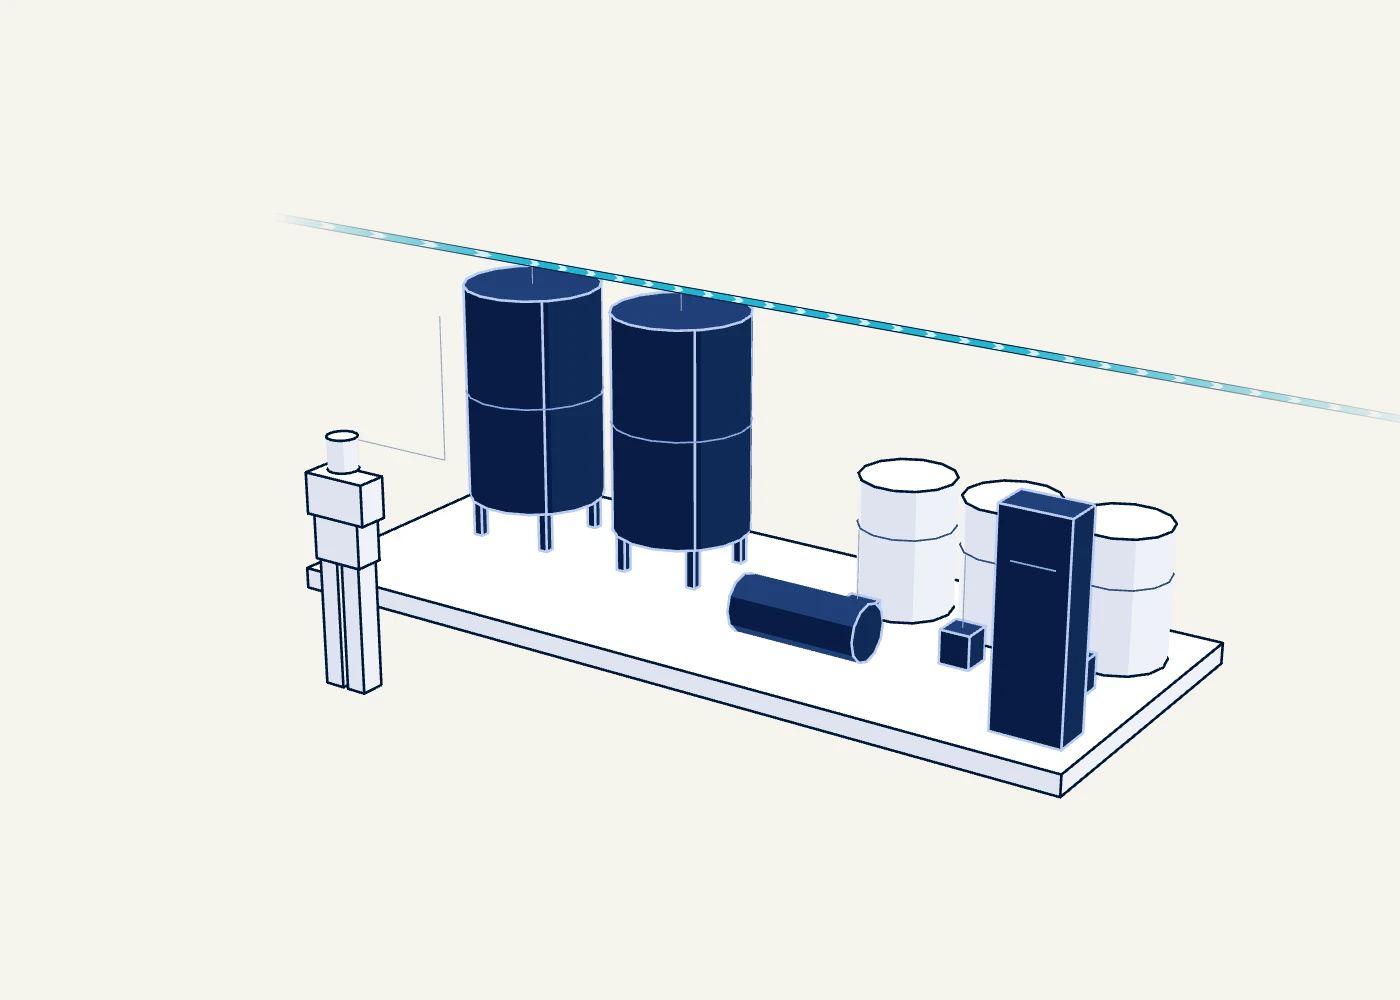
Not counted: no specification for a treatment plant was found.
The indicative site uses little water, so this is a small plant. Victoria's rules for cooling tower water are the nearest public description.
Not found
A steel frame holding trays of graphics cards, the switches that link them, and the power and coolant they need.
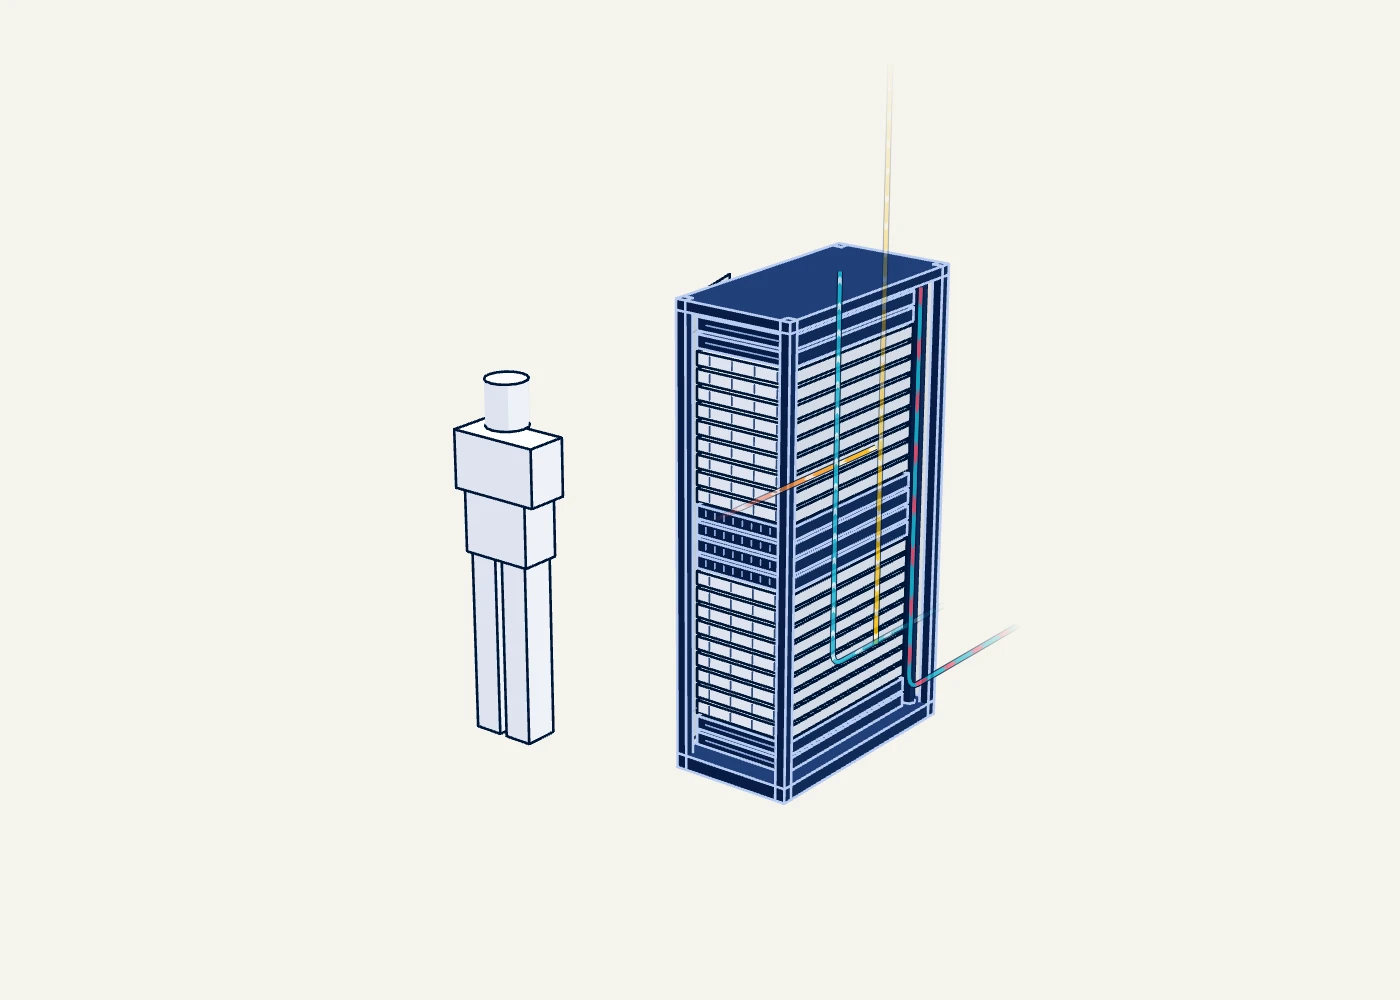
100 megawatts divided by 120 kilowatts a rack: 83 racks in each of 10 halls.
| Built for | 120 kW | Built for (60 to 125) | 50 kettles boiling at once. |
|---|---|---|---|
| An ordinary rack | 7.5 to 9.0 kW | Running at | One AI rack draws as much as 13 ordinary ones. |
| Graphics cards | 72 | Count | |
| Height of a heavy-duty cabinet | 2,011 mm | Size | 1.1 times the height of an average man. |
| A heavy-duty cabinet is rated to hold | 1,588 kg | Built for | The weight of 18 people. |
| Heat taken by liquid | 80% | Running at (75 to 85) | |
| Heat still left in the air | 24 kW | Built for | |
| Coolant through one rack | 130 L/min | Built for |
Height and load rating are for a heavy-duty cabinet of the ordinary kind. The maker's sheet for a frame made for AI racks could not be read, so its figures are not used.
Not found
Sits between the building's water and the racks' own coolant. It pumps coolant to the chips and passes their heat across without the two liquids mixing.
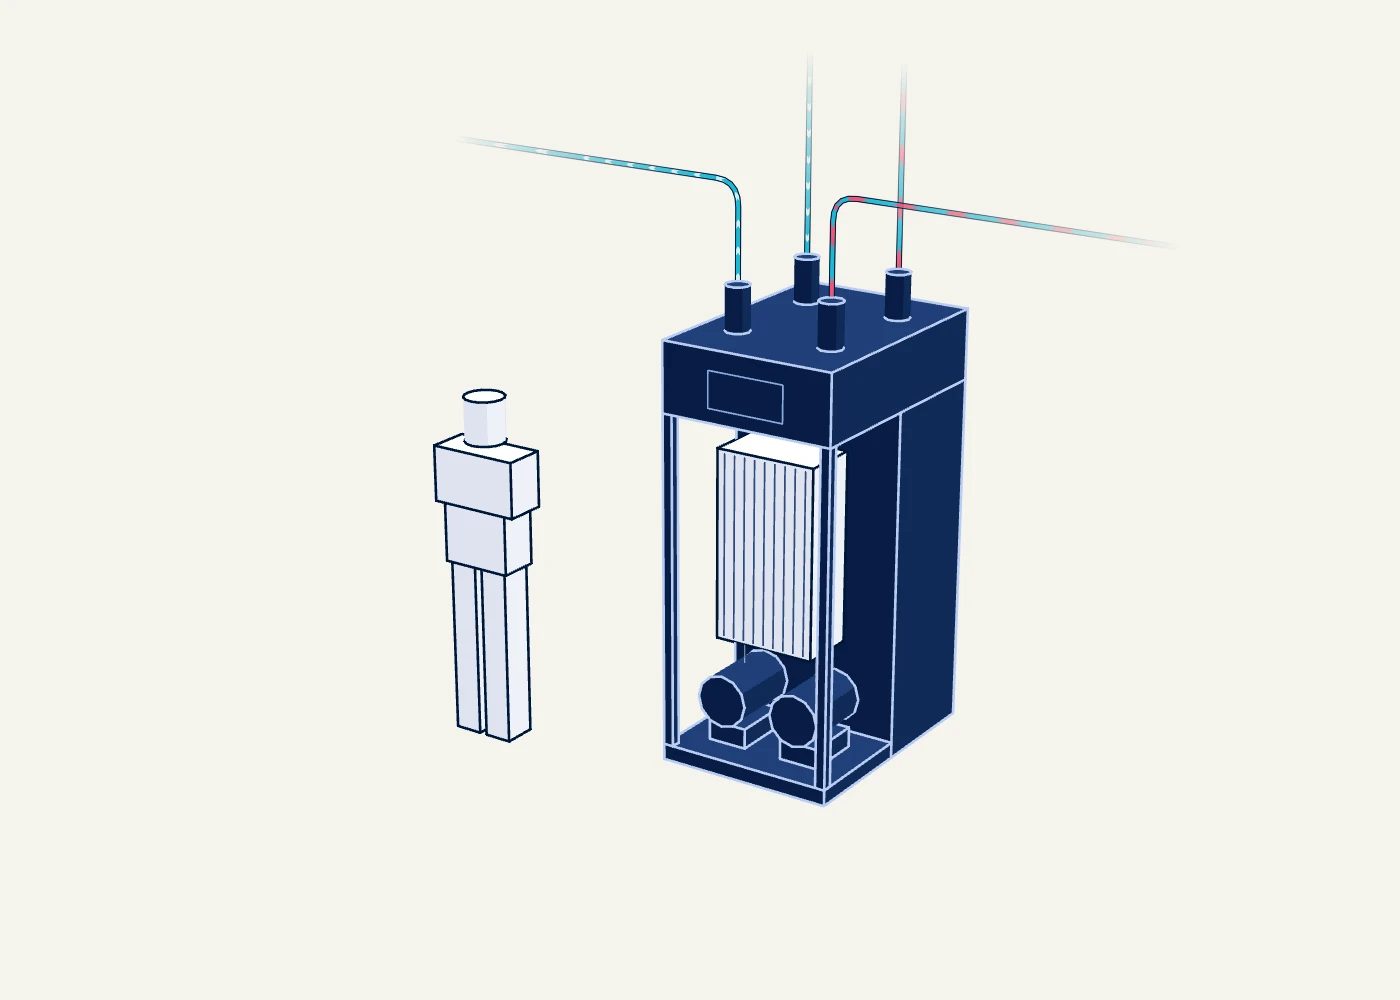
Enough to move the 80 megawatts the liquid loop carries, before spares.
| Rated to move | 1,500 kW | Built for (1,350 to 2,000) | |
|---|---|---|---|
| Pumps | 1,700 L/min | Built for (1,200 to 2,125) | |
| Width | 900 mm | Size | |
| Depth | 1,242 mm | Size | |
| Height | 2,100 mm | Size (2,069 to 2,200) | |
| Weight when full | 1,165 kg | Weight | |
| Uses | 18 kW | Uses (12.2 to 23) | |
| Noise | 68 dB(A) | Noise |
Not found
Overhead bars carry power along the row. A shelf in each rack turns it into the low-voltage direct current the servers use.
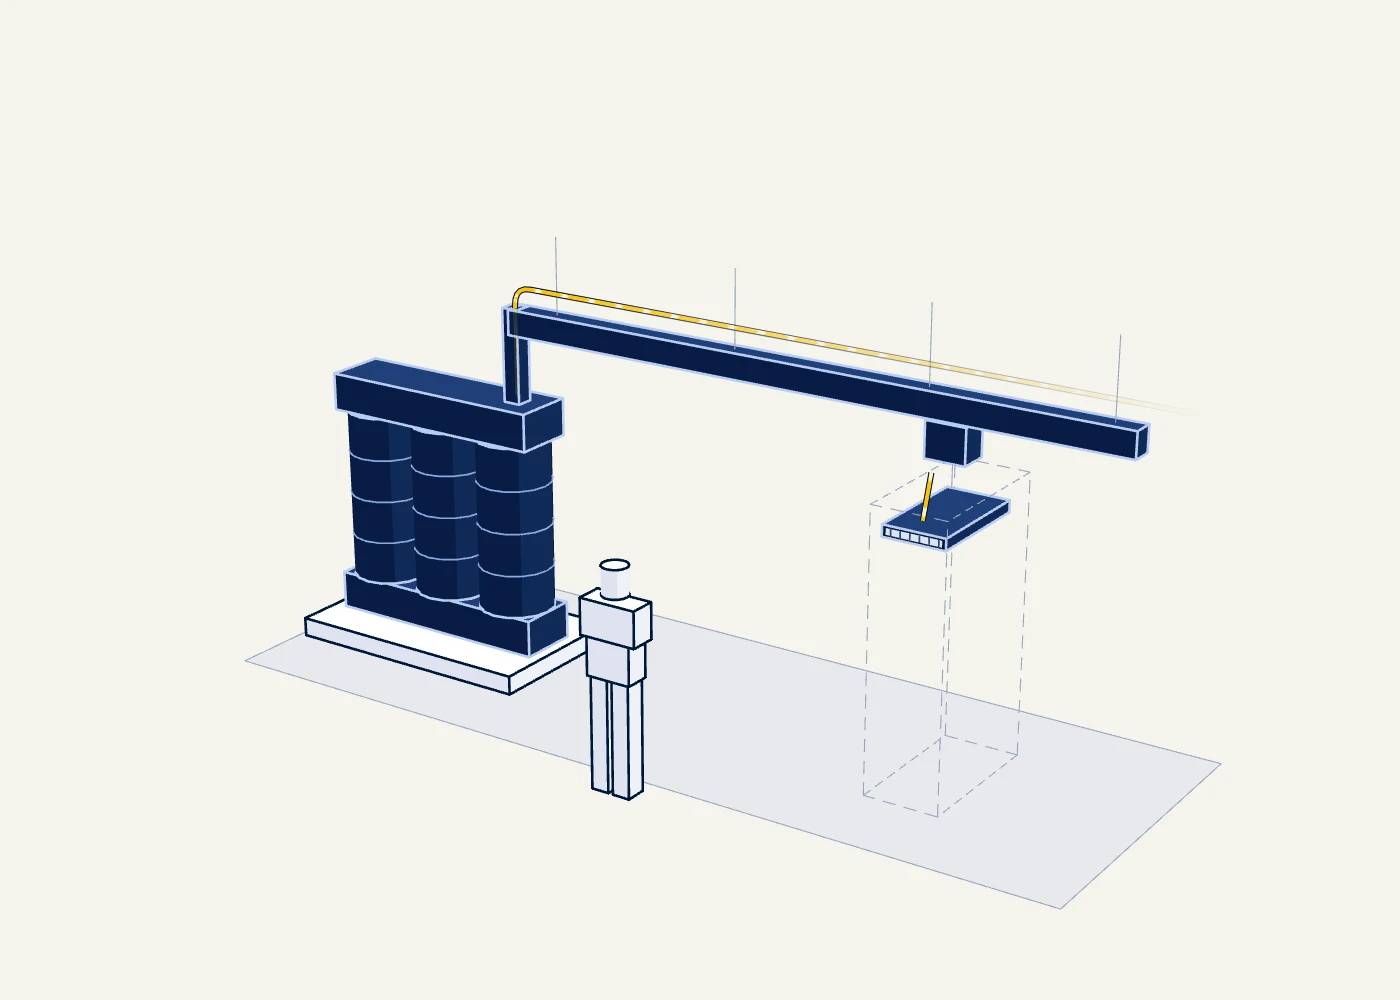
Hall transformers needed to carry 120 megawatts, before spares.
| One power shelf takes in | 100 kW | Built for | |
|---|---|---|---|
| Fed at | 400 V | ||
| Overhead bars carry | 250 to 4,000 A | Built for | |
| A hall transformer is rated for | 2,500 kVA | Built for | |
| And weighs | 5,280 kg | Weight |
The count is of hall transformers, the largest part of the row's supply. Shelves and overhead bars are not counted.
Not found
A computer built around eight graphics cards, with ordinary processors, memory and network cards to feed them.
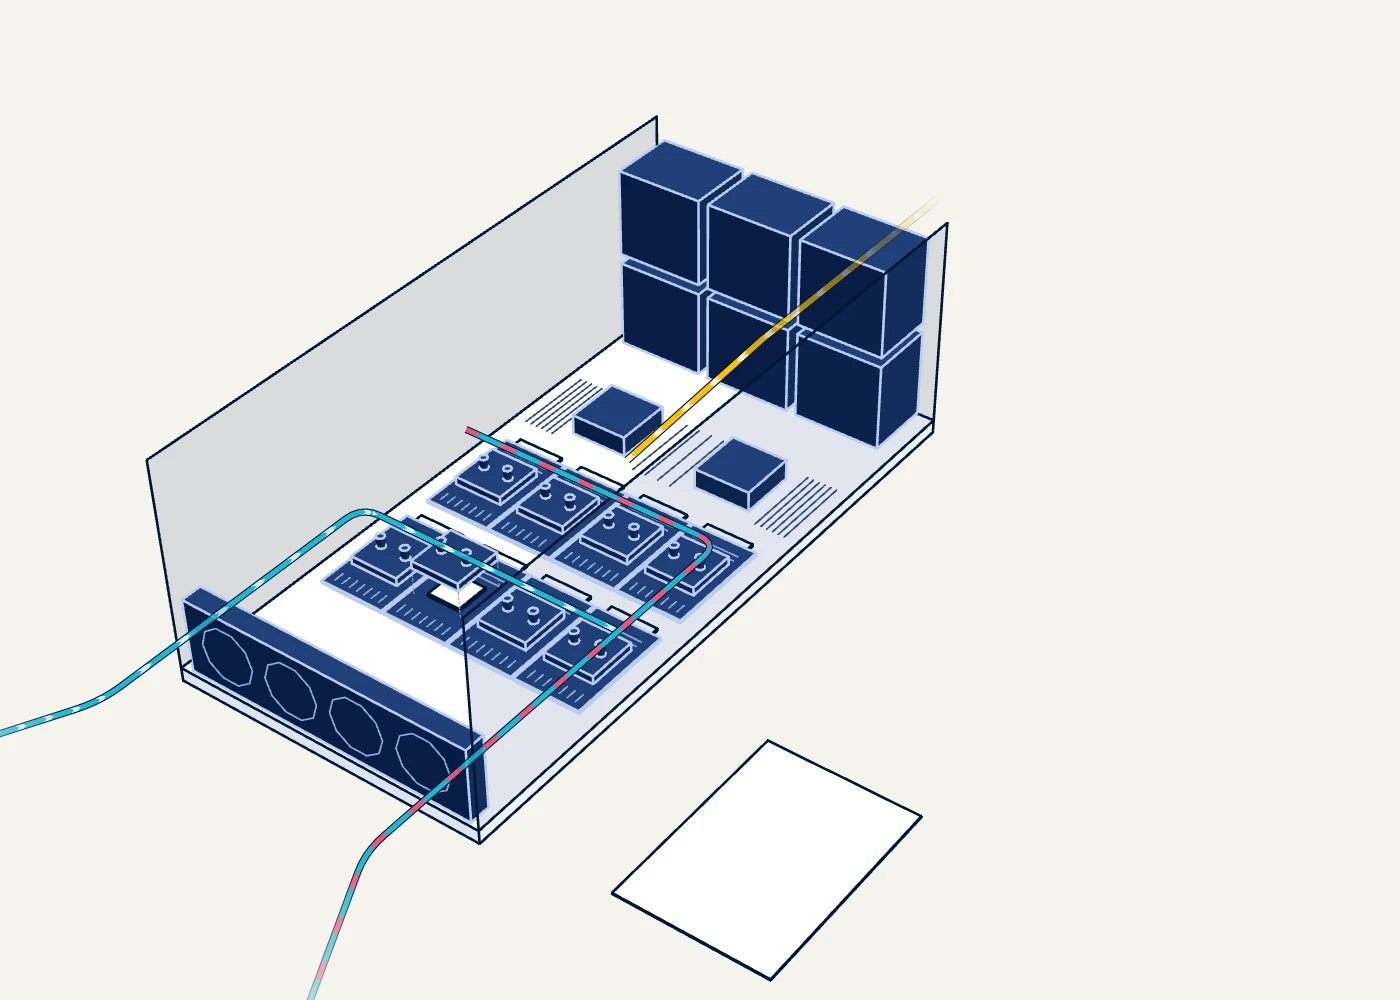
60,000 graphics cards, eight to a server.
If it stops: It has spare power supplies and keeps running if some fail. Lose too many and it shuts down.
| Built for | 12 kW | Built for (6.5 to 14.3) | 5 kettles boiling at once. |
|---|---|---|---|
| Draws, while working | 60 to 80% | Running at | |
| Graphics cards | 8 | Count | |
| Height | 330 mm | Size (219 to 444) | |
| Width | 460 mm | Size (447 to 482.3) | |
| Depth | 950 mm | Size (897.1 to 1,008.8) | |
| Weight | 120 kg | Weight (90 to 142.4) | 1.4 times the weight of an average man. |
The indicative rack holds its cards in trays, not stand-alone servers. The count is the same number of cards, counted as servers.
Not found
The chip that does the AI arithmetic. Nearly all the electricity it takes in comes out as heat.
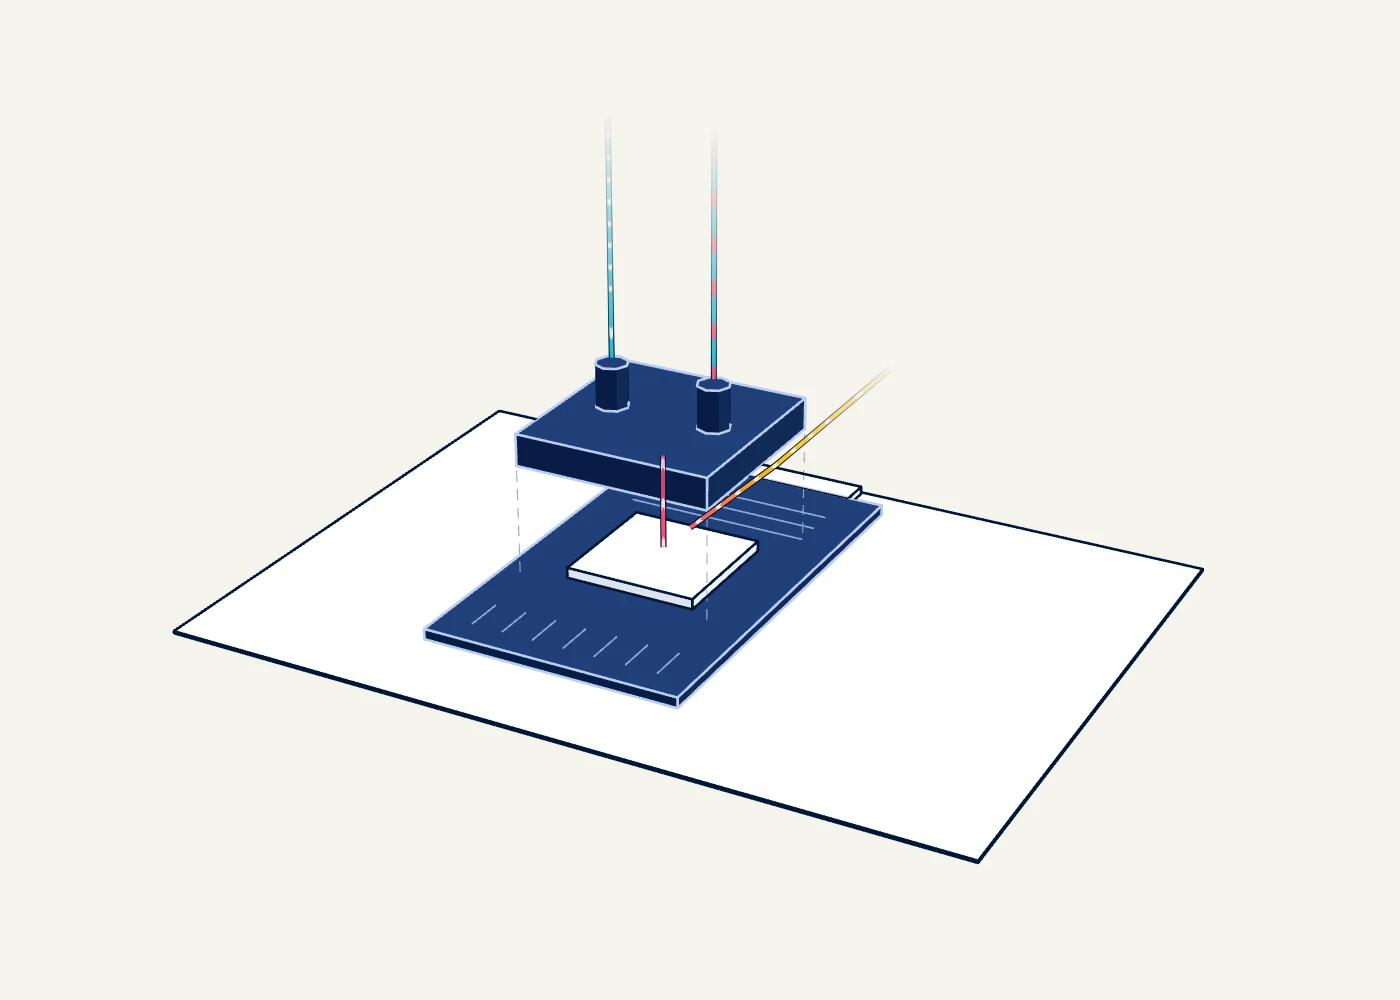
830 racks with 72 cards each.
| Built for | 1,000 W | Built for (700 to 1,000) | About what a toaster draws: 600 to 1,000 W. |
|---|---|---|---|
| Length of the module | 165 mm | Size | |
| Width of the module | 102 mm | Size | |
| Weight, with its heat sink, up to | 2 kg | Weight |
Size and weight are from an open specification for accelerator modules, not from the maker of the newest cards, which publishes neither.
Not found
Hair-thin glass that carries data as light between the graphics cards, so thousands of them can work as one machine.
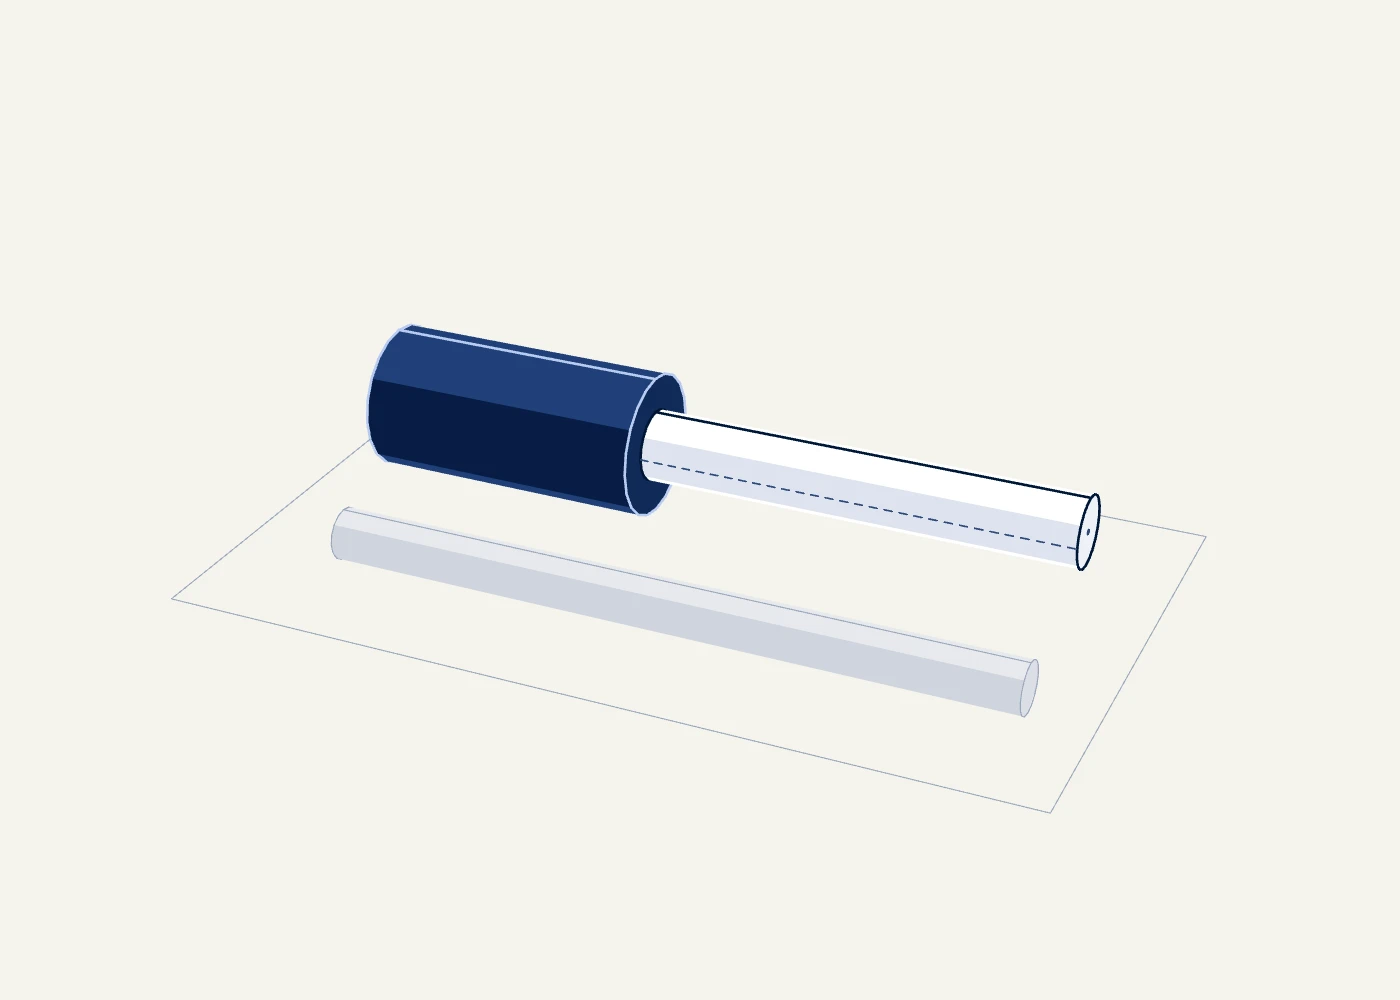
Scaled from a maker's reference design to 60,000 graphics cards. A rough estimate.
| Width of the glass | 125 µm | Size | |
|---|---|---|---|
| One link carries | 400 to 800 Gb/s | Built for | |
| Fibres in one such link | 16 | Count | |
| Network ports on each tray of cards | 4 | Count |
Not found
The site in the drawing is indicative. Each headline figure is our choice inside a range that comes from public sources.
| What | We used | Sourced range | Why |
|---|---|---|---|
| Computing load the indicative site is built for | 100 MW | 100 to 162 MW | The size an intergovernmental energy agency uses as its reference for a large data centre, and its floor for an AI-focused one. One approved Melbourne campus is larger. |
| Share of built capacity the indicative site typically draws · Single source | 70% | 60 to 80% | The central assumption a United States national laboratory uses for AI servers at work; one AI operator's own planning figure and the laboratory's test measurement sit just above it. |
| Power one AI rack is built for | 120 kW | 60 to 125 kW | The rating in the published open specification for this kind of rack, inside the range an industry survey and a government design guide report for the densest racks. |
| Share of a rack's heat carried away by liquid | 80% | 75 to 85% | The middle of the two published figures for liquid-cooled AI servers and racks. |
| Efficiency ratio of the indicative site · Single source | 1.2 | 1.0 to 1.4 | A round figure between one Australian operator's modelled figure for a liquid-to-chip design and another's reported figure for a liquid cooling system with no ongoing water draw. Dry coolers use more electricity than cooling towers, so the best published figures are not assumed. |
| Water ratio of the indicative site · Single source | 0.1 L/kWh | 0.01 to 0.7 L/kWh | Near the low end: above the figures reported for designs with almost no water draw, because this design wets its coolers on hot days, and far below a design that leans on cooling towers. |
| Minutes the batteries are designed to carry the load · Single source | 5 minutes | 5 to 16.1 minutes | The one design figure found in a Melbourne planning application; a maker's battery cabinet chart gives a longer time at its rated load. |
| Hours of generator fuel kept on site · Single source | 48 hours | 12 to 48 hours | The figure used in the two Sydney designs found; the industry's tier standard sets a lower minimum. |
| Computing load one data hall is built for · Single source | 10 MW | 6.8 to 12.3 MW | A round figure between the hall sizes in one proposed Melbourne building and the average for one Sydney campus. |
One person, an AI model, public sources and a few sessions.
Every figure sits in one file. AI researchers found each number in a public source and copied the sentence it came from. A separate AI checker, which never saw the researchers' notes, opened each source again and reported what it found. Wording the checker disputed was rewritten and checked again by a different checker. Figures that are our own arithmetic are recomputed every time the site is built.
What the first pass got wrong
What we could not find